The Federal Bureau of Revenue recently released “Tax Directory Analysis for Tax Year 2018”. The directory, a first of its kind for Pakistan, contains data on income tax by category, regions, cities, and markets. The data is for the fiscal year 2017-18[1]. This could be termed the first step by the FBR toward transparency, lending tax data for analysis by all and sundry.
Our Main Findings
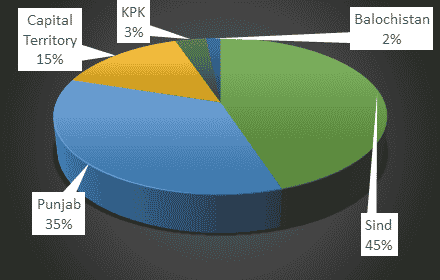
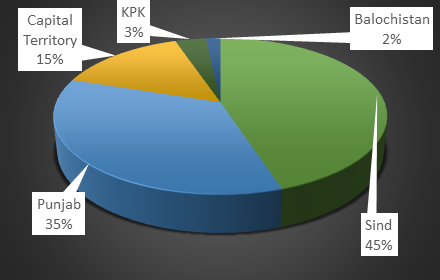
At first glance, the analysis lends support to many existing narratives on tax collection in Pakistan. The corporate sector burdens the largest share of taxes (56%). Sindh collects more taxes (45%) than any other province. Punjab with a population of 110 million, is generating taxes below its potential. Its per capita tax contribution is PKR. 4,819/- against PKR. 14,209/- collected from Sindh[2]. Tax contributions from KPK and Balochistan are paltry.
City wise, Karachi is the biggest contributor of taxes. It collects PKR. 425 billion in income tax, which is twice the amount from the next biggest contributor – the Capital Territory Islamabad (PKR. 204 billion). Lahore, the second largest city of Pakistan, contributes PKR. 201 billion. Rawalpindi, Faisalabad, Multan, Peshawar, and Quetta collectively add PKR. 93 billion to the national tax kitty (See Figure 2 below).
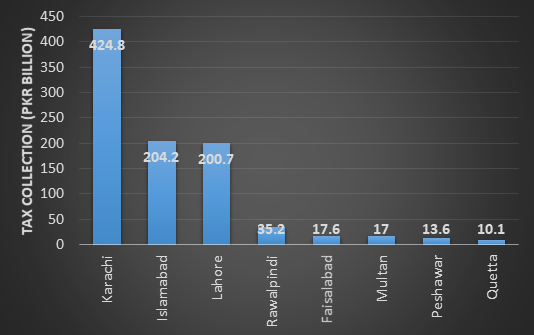
The large tax numbers from Karachi (a port city) and Islamabad (the capital city) are understandable because of the presence of the headquarters of big multinationals in these cities. But Faisalabad (PKR. 17.6 b), along with the ‘Golden Triangle’ of Gujranwala (PKR. 7.9 b), Gujrat (PKR. 1.7 b), and Sialkot (PKR. 4.5 b) present a dismal picture. Why this industrial hub is contributing so little to income tax is anybody’s guess.
Scratching the surface – some new insights
An in-depth look at the numbers, however, bursts many of these myths. Karachi has always maintained that it is the bread earner of the country. It has consistently argued that it contributes 70 percent to the tax revenue. According to Tax Directory 2018, Karachi’s contribution to income tax stands at 41 percent, which is still large but no way near the 70 percent mark[3]. It is common knowledge that Karachi, being the most populous port city, has its advantages. Port cities throughout the world are richer than the cities in the hinterland. This advantage notwithstanding, we control for population size by looking at the per capita income tax collection from the top 8 cities (Table 1)[4]. Here Islamabad emerges as way more tax compliant than Karachi. It collects PKR. 202,161/- tax per capita compared with PKR. 28,476 by Karachi, collecting revenue that is 7 times more than that of Karachi.
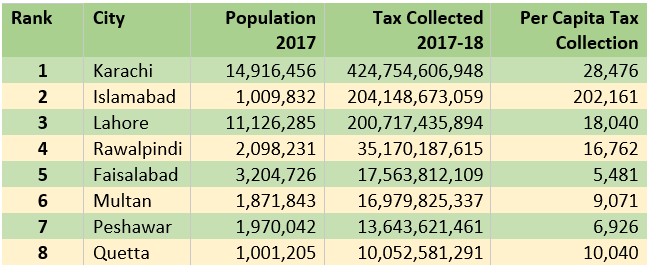
Another anomaly is the city-wise tax burden. Pakistan’s top 8 cities contribute about 90 percent of the total income tax collected (PKR. 923 billion). The other 475 cities, for which FBR has data, contribute a paltry 10 percent (PKR. 103 billion). Even a city like Sialkot, whose businessmen funded the construction of an international airport, does not make the cut for top tax paying cities, with tax contribution which is less than that of D. G. Khan (PKR. 6.4 b). This gap in the incidence of taxes is appalling.
A Distortionary Tax Policy
Previous studies have revealed that our tax policy is distortionary and relies too heavily on withholding taxes, which constitute about 70 percent of net income tax collection (Haque 2020). PIDE holds that withholdingisation of taxes is killing economics activities (Ahmed 2020) .
The Tax Directory also reveals that about 36 percent of filers have income that falls below the taxable income level. A major chunk of filers lie in the range of 2% and 5% tax rate, indicating that low rates of taxes have better compliance. Another issue is the complicated nature of the tax regime. The Lahore Chamber and Commerce President Almas Hyder narrates that “one company, operating on four provinces in Pakistan, makes 5 payments of corporate Income Tax in a year, 12 payments of Employer paid-Pension Contributions, 12 payments of Social Security contribution, 1 payment of education cess, 1 payment of property tax, 1 payment of professional tax, 1 payment of vehicle tax, 1 payment of stamp duty, 1 payment of fuel tax and 12 payments of goods and sales tax” (the Nation).
PIDE has reiterated time and again that simplification of tax processes and reducing cost of documentation will stimulate economic activities and generate tax revenues (Nasir, Faraz and Anwar 2020). It is about time our tax structure is revamped to facilitate and motivate taxpayers through low, simple and fair taxation regime.
Tax Directory Analysis 2018 – Gaps and Recommendations
The tax Directory leaves many gaps in its analysis. Among these are:
- Information on the total tax collected is missing from the analysis. One must rely on data given in the FBR Yearbook 2017-18 to make sense of how much each province, city or corporate sector has contributed to numbers.
- Data across different publications do not match-up. This discrepancy causes confusion for the researchers. As Ikramul Haq et al have said that It is surprising that the FBR and its Inland Revenue Department with a staff of 15000 couldn’t provide a transparent and reliable information on tax collection.
- The FBR has published all three Directory’s in a PDF format, which does not lend data for quick and easy interpretation. It is surprising that the Pakistan Revenue Automation Private Limited, the IT company of the FBR could not provide an error free fact-sheet of tax collection, opines Ikramul Haq et al.
- In future, the provision of error free data in a format that is easily amenable to interpretation would be welcomed.
[1] A “Parliamentarians’ Directory for Tax Year 2018” and a “Tax Directory for All Taxpayers for Year 2018” were also released alongside.
[2] Per capita tax collection is arrived at by dividing population of respective provinces. The source of population is the Population
[3] Karachi’s share is obtained by dividing the tax collected from Karachi (PKR. 425 b) by total income tax from all cities (PKR. 1,026 billion).
[4] The top 8 cities are selected on the basis of population 2017.