Poverty Trend in Pakistan: A Glimpse from Last Two Decades
Hania Afzal & Henna Ahsan, Pakistan Institute of Development Economics, Islamabad.
INTRODUCTION
Poverty reduction is one of the most important sustainable development goals set by the UN in 2015. According to this goal, Pakistan must reduce its poverty level to half by 2030 from 24.3 percent to 12 percent. Pakistan is making hard efforts to achieve this target although the COVID-19 pandemic has made it difficult to achieve this goal due to severe macroeconomic imbalances in the economy.
This brief provides the consistent data series of poverty in Pakistan from 1998 to 2019 using the CBN estimation method. If we look at the historical data, it suggests that poverty has declined to some extent in Pakistan at the national as well as provincial level. Sustained economic growth is considered as the important driver of poverty reduction and in Pakistan, there is a need to maintain an economic growth of around 6 percent to 7 percent to alleviate about 30 percent of the population living under poverty. It is evident from the statistics that the early 2000s were a period of high economic growth and this growth translated into low poverty rates. Whereas after 2006 GDP grew at a decreasing rate as compared to preceding years resulting in low poverty decline and subsequently resulting in a greater number of potential poor in the country. Therefore, this knowledge brief aims to discuss different groups of poor people present in the country by categorising these at different poverty levels. This categorisation will help us to get a deep insight into the state of poverty across the country from 1998 to 2019 and will help policy-makers to formulate more specific and relevant policies concerning these different poverty groups.
PIDE’S CONTRIBUTION IN MEASURING & EVALUATING POVERTY
PIDE has a vast history of measuring poverty and its characteristics by conducting various surveys for reaching the exact figures to help policy-makers better understand the phenomena and formulate the right policies. In reference to this, PIDE conducted surveys in three different rounds (first in 2001, second in 2004 and third in 2010) under a program of Pakistan Panel Household Survey (PPHS).
The various studies have been analysed covering the following aspects of poverty; its characteristics causes of intergenerational poverty and evaluating the impact of poverty alleviation program.
- By using the data of PPHS Arif and Farooq (2014) analysed the dynamics of rural poverty, its characteristics, and determinants.
- Another study was conducted to examine the trends in child malnutrition during the last decade (2000 –2010) using two rounds of PPHS, and to find the correlation between poverty and child malnutrition. The study reveals that a high level of malnutrition exists among children, but there is no significant association between poverty and child malnourishment or between perceived food shortages and child malnutrition. The results rather suggest that exposure to disease is the major cause of poor child growth, and the latter cannot necessarily be solely attributed to poverty (Arif, et al. 2014).
- The single cross-section data can be misleading to analyse the poverty trap. Therefore, PPHS provides a better picture of intergenerational poverty. The study of Javed and Mohammad (2014) concluded that a father’s socioeconomic status remains the most crucial determinant of the economic position of the son. A plausible explanation can be the lower investment in education does not enable the poor children to come out of poverty.
- The study on Shocks and Vulnerability of Poor by Haq (2012) analyses the factors of vulnerability, defined as households’ exposure to shocks and their limited ability to mitigate the impact of these shocks by using data of PPHS-2010. The findings suggest that approximately one-fourth of the sampled households experienced an adverse shock during 2006-2010 in the form of natural/ agricultural shocks (51.1 percent), or economic shocks (3.3 percent), or social shocks (9.8 percent) or health shocks (35.8 percent).
- The study by Arif, et al. (2012) analysed the impact of government interventions through the Lady Health Workers Program (LHWP) for improving the health and welfare of the poor in Pakistan.
- The knowledge brief by Iqbal (2020) indicates that Pakistan headcount index has consistently declined in the last two decades from 50.4 percent in 2005-06 to 22.5 percent in 2018-19. However, estimates show that poverty has declined in all provinces except KPK where it increased from 18.1 percent in 2015-16 to 27 percent in 2018-19 (an increase of 8.9 percentage point). It reflects a significant downward movement of vulnerable in KPK.
- The study of Nayab and Farooq (2014) suggested that Benazir Income Support Program (BISP) did not have an impact on household socio-economic wellbeing across and over time. It has been observed that there is a need to give space to the poor to grow as mere money handouts would not do so. A cash transfer cannot be a substitute for opportunity and exclusion from opportunity is the biggest reason for people staying poor.
Finally, PIDE took out a whole issue of its Policy and Research (P&R) magazine (2021) on issues related to poverty. This includes measuring poverty by different methods to evaluate the impact of different models on poverty alleviation like the Social Action Program (SAP) in the 1990s and the different micro-financing schemes.
METHODS TO ESTIMATE POVERTY
The official poverty rates have been estimated using the HIES surveys conducted by Pakistan Bureau of Statistics (PBS). Different approaches are used for estimating poverty that include Food energy intake method, Multidimensional poverty index and Cost of basic needs method. Government of Pakistan for the first time calculated its official estimates of poverty using CBN methodology in 2013-14, reason being CBN method is considered more efficient as it covers the moderate poverty and uses the criteria of minimum income required to remain non poor. So, we are using the Cost of Basic Needs Method (CBN) for ten Household Integrated Economic Survey (HIES) from 1998-99 to 2019-19 for estimating poverty. As the HIES was not conducted with regular intervals of time so there were some missing values for certain years. These missing values in the data set have been generated using the interpolation techniques by linear interpolation methods. This method applies a distinct linear polynomial between each pair of data points for curves, or within the sets of three points for surfaces. These poverty lines are adjusted for inflation based on consumer price Index (CPI). These adjusted poverty lines were then used to estimate poverty levels in four provinces at rural and urban level.
POVERTY LINE
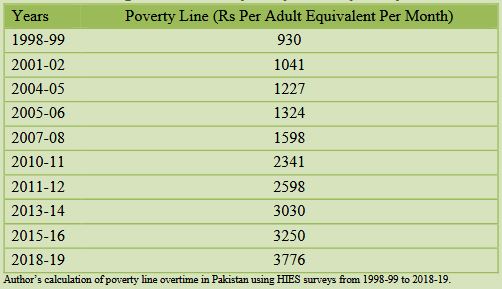
The cost of Basic Need (CBN) Method has been adopted to calculate the poverty line for various HIES starting from 1998-99 to 2018-19. The CBN Method uses food as well as non-food expenditures (clothing, shelter, education etc.) that are necessary for households for calculating the poverty line, focusing on households who can fully meet the Food Poverty Line at their current level of food expenditures. The estimated poverty line for 1998-99 was calculated at Rs 930 per adult equivalent per month. The poverty line for each year has been deflated by CPI inflation. The updated poverty line showing the increasing trend due to an increase in inflation, therefore for the year 2018-19 the poverty line per adult equivalent per month is reached RS 3776. The CBN poverty lines for various survey years are reported in Table 1.
Table 1
Poverty Line Estimates Using CBN Method Adjusted for CPI Inflation from 1998-99 to 2018-19
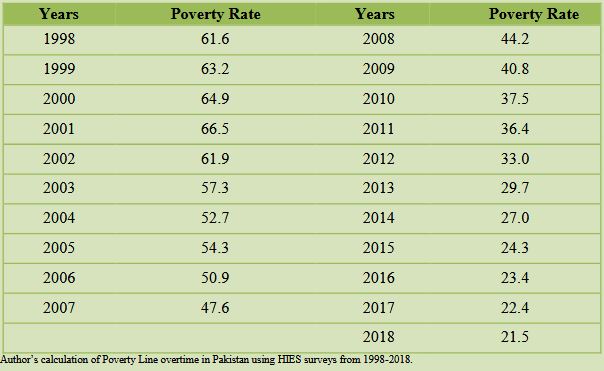
POVERTY RATES OVER TIME
Poverty rates have been calculated using the HIES surveys and the missing values in the data set have been generated using the interpolation techniques by linear interpolation methods. This method applies a distinct linear polynomial between each pair of data points for curves, or within the sets of three points for surfaces. It is an effort by PIDE to generate consistent series of poverty rates that can further be available for research purpose.
The below figure shows the poverty trend in Pakistan from 1998- 99 to 2018-19. It can be inferred from data that poverty estimates showed some mixed trend during the initial years of 2000 and the declining trend of poverty estimates started from 2005-06 and continued till 2018-19.
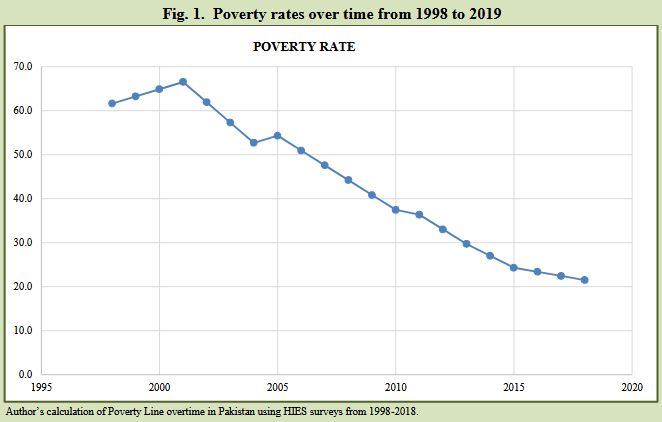
Table 2
Poverty Rate from 1998-99 to 2018-19

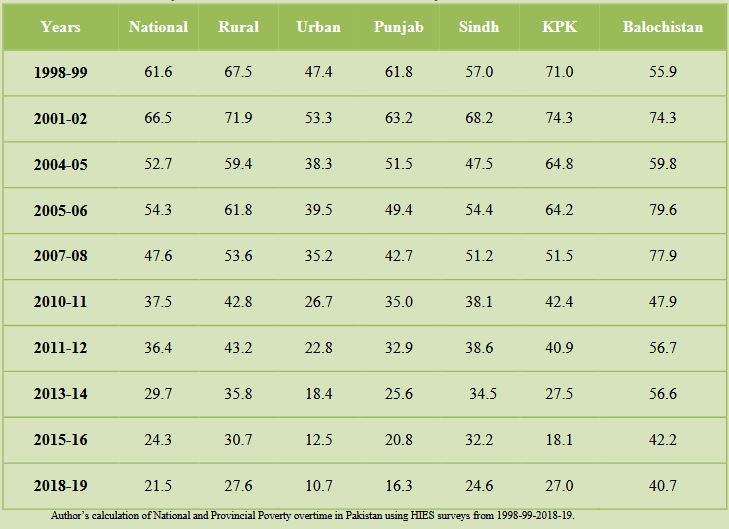
POVERTY ESTIMATES FROM 1998-99 TO 2018-19
When we have a look at rural/urban categorisation of poverty estimates we see that rural poverty is significantly higher than urban poverty. The reason for these higher poverty figures against rural areas could be a greater percentage of people especially poor concentration in rural areas where they usually do not have access to health, education, and employment opportunities. According to Todaro (2000), around 80 to 90 percent of poor individuals in Africa and Asia live in rural areas.
The provincial estimates somehow give a clear picture of poverty across Pakistan at the regional level. In 1998-99, poverty was observed to be highest in the province of KPK at 71 percent and lowest in Balochistan at 55.9 percent but this trend is reversed in 2018-19 as the lowest percentage of poverty which is 16.3 percent was recorded in the province of Punjab and highest in Balochistan at 40.7percent. Many factors contribute towards such alarmingly high figure of poverty in Balochistan of which majors could be high levels of income inequality and low employment opportunities.
Table 3
Poverty Trends at Provincial Level in Pakistan from 1998-99 to 2018-19
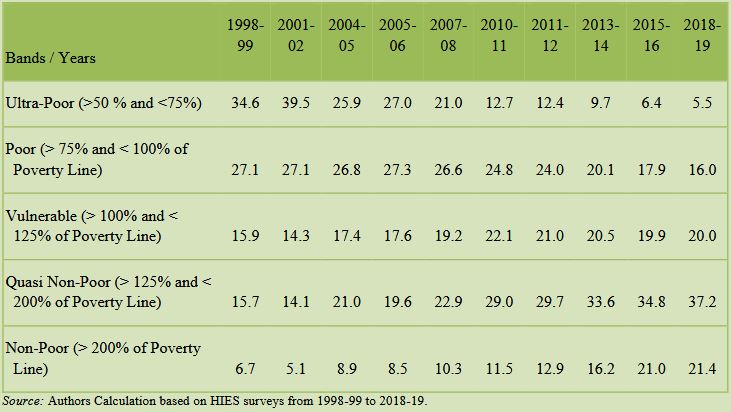
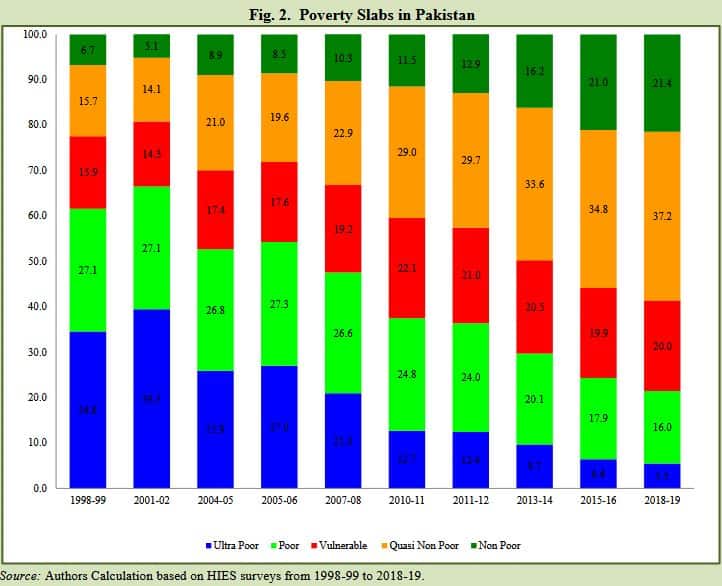
POVERTY SLABS IN PAKISTAN FROM 1998 TO 2019
The headcount index measures the proportion of the population that is poor, but it does not indicate how poor the poor are. Therefore, the poverty situation defined through different poverty slabs has very serious policy implications as grouping people into different poverty slabs help in targeted policy initiatives for these groups. The five different levels of the poor defined for this research are Ultra poor people which are 50 percent below the poverty line, Poor-which are between 50 percent to 75 percent of the poverty line, Vulnerable poor group which are between 100 and 125 percent of the poverty line, Quasi poor-people which are greater than 125 percent and less than 200 percent of the poverty line and finally Non-Poor which are people above 200 percent of the poverty line. The graph shows that percentage of ultra-poor has decreased significantly starting from 27 percent in 2005-06 to 5.5 percent in 2018-19. It is a good sign that extremely poor people have decreased over time. Those defined as the vulnerable poor show a mixed trend with the highest percentage at 22.1 percent in 2010-11 and lowest at 14.3 percent in 2001-02. Similarly, it has been observed for the non-poor as the non-poor percentage have increased from 8.5 percent in 2005-06 to 21.4 percent in 2018-19 which means that non-poor people have almost more than doubled from 2005-06 till 2018-19.
Table 4
Poverty Slabs Overtime in Pakistan from 1998-99 to 2018-2019
CONCLUSIONS
The poverty rate in Pakistan has declined significantly from 1998 to 2019 and also by region urban and rural. The number of non-poor people has increased from 6.7 percent to 21.4 percent. It means that the overall poverty level has reduced, and more people have got access to basic facilities like food, health, education, and employment. So, from the above analysis and literature, we can conclude that poverty levels have declined across Pakistan due to the following reasons.
- (1) Periods of high economic growth translated into poverty reduction.
- (2) Successful implementation of traditional and modern programs for alleviating poverty. These programs include the social safety net programs including the Ehsaas Strategy BISP, WWF and Zakat.
In the end, we would like to suggest that government must set some proper monitoring strategy that poorest of the poor people are getting benefits from the social safety net programs and these programs are acting as employment generation opportunities as it will help reduce poverty levels significantly.
REFERENCES
Arif, G., & Farooq, S. (2014). Rural poverty dynamics in Pakistan: Evidence from three waves of the panel survey. The Pakistan Development Review, 53(2), 71–98.
Arif, G., Farooq, F., Nazir, S., & Satti, M. (2014). Child malnutrition and poverty: The case of Pakistan. The Pakistan Development Review, 53, 99–118.
Arif, G., Nayab. D., Farooq, S., Nazir, S & Satti, M.(2012). Welfare impact of the health intervention in Pakistan: The case of lady health workers programme. Pakistan Institute of Development Economics, Islamabad. (Poverty and Social Dynamics Paper Series 2012:07).
Haq, R. (2015). Shocks as a source of vulnerability: An empirical investigation from Pakistan. The Pakistan Development Review, 54, 245–272.
Iqbal, N. (2020). National poverty estimates 2018-19. Islamabad, Pakistan.
Javed, S., & Irfan, M. (2014). Intergenerational mobility: Evidence from Pakistan panel household survey. The Pakistan Development Review, 53, 105–133.
Nayab, D. and S. Farooq (2014). Effectiveness of cash transfer programmes for household welfare in Pakistan: The case of the Benazir income support programme. The Pakistan Development Review, 53(2), 145–174.
Pakistan, Government of (2018-19). Government of Pakistan, Finance Division. Retrieved from http://www.finance.gov.pk/survey_1819.html
Pakitan Bureau of Statistics. (n.d.). Retrieved from https://www.pbs.gov.pk
PIDE (2021). Including the excluding. Policy and Research, 2(4).
Todaro, Michael P. (2000), Economic development. (7th edition). Addison Wesley, p. 170.