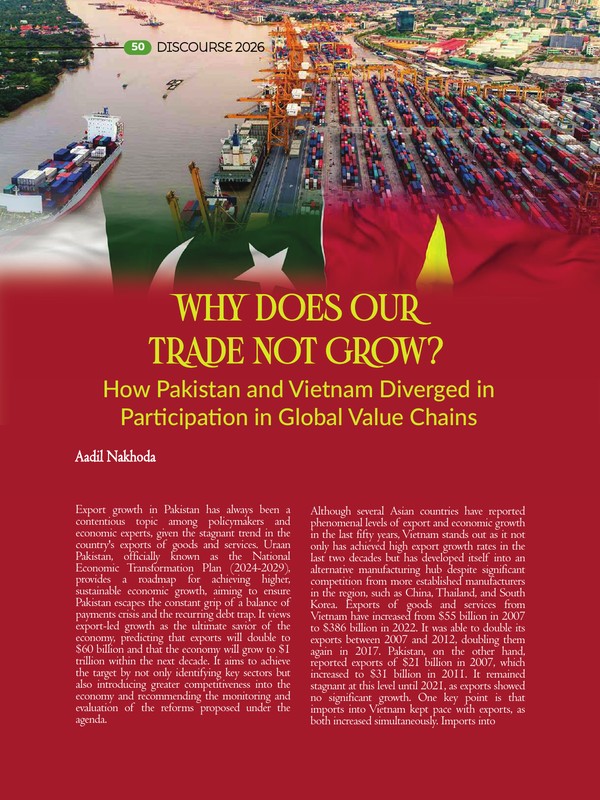
Export growth in Pakistan has always been a contentious topic among policymakers and economic experts, given the stagnant trend in the country’s exports of goods and services. Uraan Pakistan, officially known as the National Economic Transformation Plan (2024-2029), provides a roadmap for achieving higher, sustainable economic growth, aiming to ensure Pakistan escapes the constant grip of a balance of payments crisis and the recurring debt trap. It views export-led growth as the ultimate savior of the economy, predicting that exports will double to $60 billion and that the economy will grow to $1 trillion within the next decade. It aims to achieve the target by not only identifying key sectors but also introducing greater competitiveness into the economy and recommending the monitoring and evaluation of the reforms proposed under the agenda.
Although several Asian countries have reported phenomenal levels of export and economic growth in the last fifty years, Vietnam stands out as it not only has achieved high export growth rates in the last two decades but has developed itself into an alternative manufacturing hub despite significant competition from more established manufacturers in the region, such as China, Thailand, and South Korea. Exports of goods and services from Vietnam have increased from $55 billion in 2007 to $386 billion in 2022. It was able to double its exports between 2007 and 2012, doubling them again in 2017. Pakistan, on the other hand, reported exports of $21 billion in 2007, which increased to $31 billion in 2011. It remained stagnant at this level until 2021, as exports showed no significant growth. One key point is that imports into Vietnam kept pace with exports, as both increased simultaneously. Imports into Pakistan have typically outpaced exports, rising from $35 billion in 2007 to $84 billion in 2022. This divergence between the two has often led to a balance-of-payments crisis fueled by Pakistan’s trade deficit. Vietnam, without much of its own indigenous resources to produce exportable output, has relied on imports of key capital goods and unfinished goods to boost domestic production and, in turn, increase exports. This linkage has made it an important participant in regional and global value chains (GVCs).
Contrary to Pakistan, Vietnam has pursued trade policies that have allowed its businesses to import unfinished and capital goods, while ensuring they remain competitive in the global market by avoiding trade restrictions on consumer goods. Their policymakers have reduced import tariffs from 9 percent in 2007, which was much closer to the value of 12 percent reported by Pakistan in 2007, to almost 1 percent in 2022. This dynamism in their trade policy has been a major factor in increasing their participation in global value chains. Further, the share in value addition from the manufacturing sector in Vietnam was 25 percent in 2022, compared to 14 percent in Pakistan, indicating higher manufacturing capabilities in Vietnam. The following discussion will shed further light on the tariff policies adopted by Pakistan and Vietnam, whose trade patterns diverged over the last 20 years.
The data on trade values is extracted from the World Bank’s World Development Indicators; the data on GVC participation is extracted from the Asian Development Bank’s multiregional input-output database; and the data on tariffs is extracted from the World Bank’s World Integrated Trade Solution (WITS). The products are classified into different stages of production using the reference list provided by WITS.
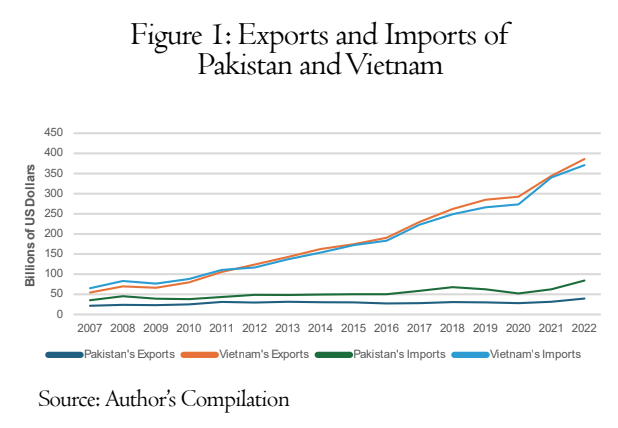
The exports and imports of goods and services of Pakistan and Vietnam between 2007 and 2022 are reported in Figure 1. There is a clear divergence in trade volumes between Pakistan and Vietnam: Vietnam increased its exports and imports by more than six times, while Pakistan doubled its imports; its exports remained stagnant throughout the period. While Vietnam achieved its desired export-led growth, outpacing several regional competitors that also reported stellar performances, Pakistan remained a laggard, with its share of global trade shrinking over time.
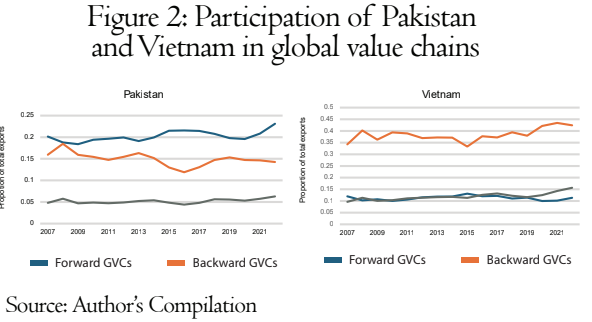
The participation of Pakistan and Vietnam in GVCs is reported in Figure 2. There are two primary ways to measure participation in GVCs, where goods cross an international border more than once in their production process. Forward GVC participation is measured as the share of total gross exports incorporated into the exports of the importing partner to trading partners, while backward GVC participation is measured as the share of total gross exports to a trading partner produced with imported inputs from other source countries. Two-sided GVCs involve a combination of backward and forward linkages in international activities[1]. While total participation in GVCs has typically been less than 40 percent in Pakistan, it has exceeded 50 percent in Vietnam. Pakistan’s participation in GVCs is dominated by forward linkages, while Vietnam’s is dominated by backward linkages. The forward GVCs constitute more than 20 percent of gross exports from Pakistan, while backward GVCs constitute more than 40 percent in recent years. This suggests that exports from Pakistan are more likely to be in the form of unfinished products and further processed into exportable output in the trading partners. In contrast, imports into Vietnam are further processed into exportable output domestically and exported as final goods to its trading partners. The manufacturing sector in Vietnam is likely to play a crucial role in developing backward linkages, whereas Pakistan’s lack of manufacturing capabilities has led to the prominence of forward linkages in GVCs.
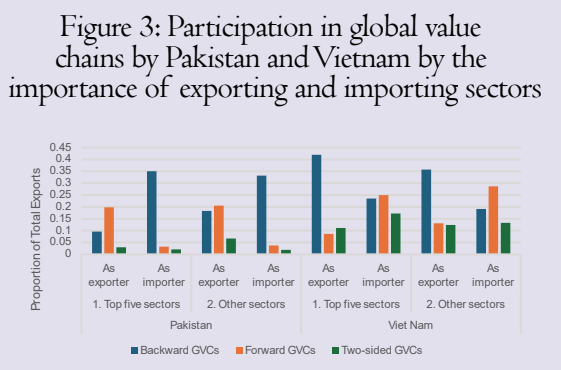
The participation in GVCs, disaggregated in terms of backward, forward and two-sided, in the leading export and import sectors of Pakistan and Vietnam, is reported in Figure 3. The top five sectors, classified according to the International Standard Industry Classification (ISIC) revision 3.1, in terms of recording the highest levels of exports and imports are reported in Table 1 below. Pakistan, which is more likely to export products that are further processed into exportable outputs in the trading partner, as reported earlier, exhibits higher levels of forward linkages as an exporter and higher levels of backward linkages as an importer than Vietnam. Further, Vietnam reports higher backward linkages as an exporter and higher forward linkages as an importer than Pakistan, largely reversing the trend observed in Pakistan across sectors. While higher levels of forward linkages for an exporter suggest that more export processing activities are likely to occur in the exporter’s trading partners, the prominence of backward linkages for an importer suggests that more value-added manufacturing processes are likely to occur in the exporting country, where imported inputs are transformed into exports. Further, the prominence of backward linkages as an exporter suggests that Vietnam is adding larger value to imported inputs from its trading partner and processing them into exports. In contrast, the prominence of forward linkages as an importer suggests that Vietnam is adding greater value to inputs from its trading partners and processing them for further exports. The two-sided GVCs are almost non-existent in Pakistan, whereas they are more prominent in Vietnam across sectors. This again clearly suggests that Vietnam’s manufacturing sectors are likely adding value to trade relative to Pakistan’s, as trading partners exporting to Vietnam rely on its manufacturing capabilities for further export-based production. This also signifies a critical link between exports and imports, which is likely supported through lower tariffs and trade restrictions.
Table 1: Top five export and import sectors of Pakistan and Vietnam
| Pakistan | Vietnam | ||
| Top five export sectors | Top five import sectors | Top five export sectors | Top five import sectors |
| Food, beverages and tobacco
|
Food, beverages and tobacco
|
Food, beverages and tobacco
|
Coke, refined petroleum and nuclear fuel
|
| Textiles and textile products
|
Coke, refined petroleum and nuclear fuel
|
Textiles and textile products
|
Chemicals and chemical products
|
| Leather, leather products and footwear
|
Chemicals and chemical products
|
Leather, leather products and footwear
|
Basic metals and fabricated metals
|
| Chemicals and chemical products
|
Basic metals and fabricated metals
|
Basic metals and fabricated metals
|
Machinery, not elsewhere classified
|
| Manufacturing, not elsewhere classified; recycling
|
Manufacturing, not elsewhere classified; recycling
|
Electrical and optical equipment
|
Electrical and optical equipment
|
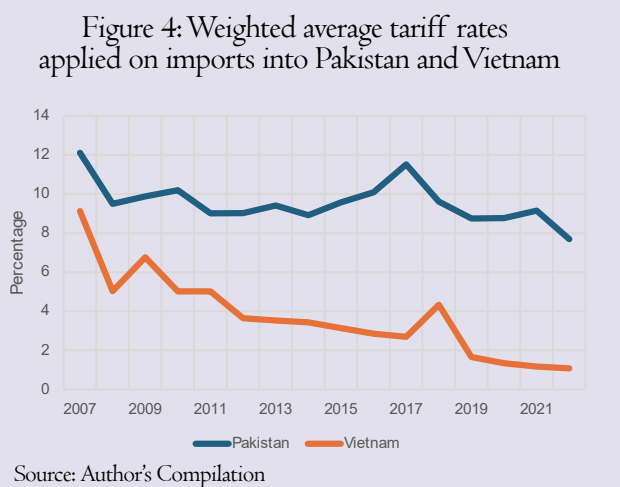
The weighted average tariff rates applied on imports into Pakistan and Vietnam between 2007 and 2022 are reported in Figure 4. Vietnam has reduced its tariff rates from 9.1 percent in 2007 to 1.08 percent in 2022, clearly demonstrating the Vietnamese government’s preference for eliminating import tariffs and duties. Although there is a decreasing trend in tariffs on imports into Pakistan between 2007 and 2022, the average tariff rate has decreased only from 12 percent in 2007 to 7.7 percent in 2022. Pakistan imposes relatively higher import tariffs than several of its Asian counterparts, particularly Vietnam. The next figures will delve deeper into tariff analysis by disaggregating imports at the product level.
[1] Examples of forward linkages are exports of yarn from Pakistan to China, which is then further processed into t-shirts and exported to the US. Examples of backward linkages are imports of integrated circuits into Vietnam from China that are further used in the production of mobile phones exported to the EU from Vietnam. Two-sided linkages are exports of cotton from US to Pakistan, which is exported to China as yarn and further transformed into a t-shirt in China for export to the EU.