
Executive Summary
This knowledge brief examines the ongoing structural shift in the global monetary and energy-pricing system from the long-standing U.S. dollar-based petrodollar regime toward the emerging Petroyuan framework. Drawing on historical analysis, theoretical insights, and empirical data from 1970 to 2026, it explores how oil pricing shapes global liquidity, inflation, exchange rates, capital flows, and financial stability. The petrodollar system historically reinforced U.S. dollar dominance and enabled the large-scale recycling of oil revenues into global financial markets. Recent structural changes — geopolitical fragmentation, China’s rise, Western sanctions, and diversification of energy trade — have begun to erode these relationships. The emerging Petroyuan introduces a more multipolar monetary landscape. For oil-importing economies such as Pakistan, currency diversification may offer marginal but meaningful benefits, yet external vulnerabilities remain binding constraints. Pakistan’s structural deficit with China — $9.5 billion in imports versus $1.2 billion in exports in H1 FY2025-26 — combined with $29–30 billion in Chinese bilateral debt, creates a paradoxical yet compelling case for a calibrated yuan-based settlement that could reduce dollar dependence without deepening single-counterparty risk. The brief concludes that the transition will be gradual and potentially destabilizing without coordinated domestic and multilateral policy responses.
1. INTRODUCTION
Since the collapse of the Bretton Woods system in 1971, the global economy has been profoundly shaped by the pricing of oil in U.S. dollars — the petrodollar system. This mechanism was not merely a technical feature of trade; it became a foundational pillar of the global macroeconomic architecture. By requiring oil-importing countries to hold dollar reserves, it entrenched the dollar as the dominant reserve and transaction currency. Equally significant was petrodollar recycling, through which oil-exporting countries reinvested surplus revenues into U.S. Treasury securities and Western banking systems, thereby expanding global liquidity, lowering interest rates, and facilitating international credit expansion.
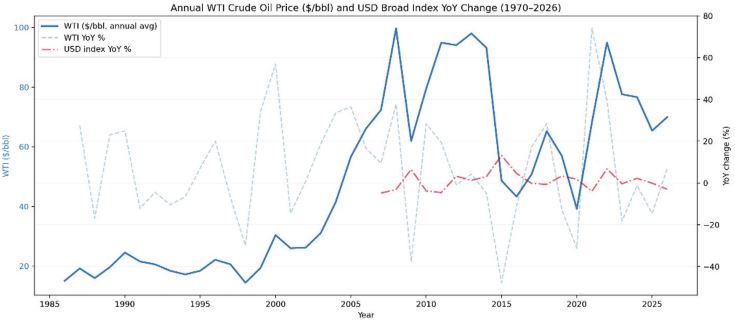
Figures 1 and 2 illustrate the evolution of the relationship between oil prices (West Texas Intermediate, WTI) and the U.S. dollar index. In the earlier period (pre-2000), the correlation appears weak and inconsistent. From the 2000s through the mid-2010s, a pronounced inverse relationship emerged: rising oil prices generally coincided with a weaker dollar, reflecting classical petrodollar dynamics. Since 2015, particularly around the 2020 COVID-19 shock and the 2022 Russia–Ukraine conflict, this relationship has become increasingly unstable and nonlinear — signalling a structural breakdown in traditional oil-dollar dynamics and a transition toward a more fragmented global monetary environment.
This knowledge brief traces the historical evolution of the petrodollar system, analyses the structural drivers behind the emergence of the Petroyuan, examines macroeconomic implications across key channels — exchange rates, interest rates, inflation, and global liquidity — and situates Pakistan’s specific vulnerabilities and strategic options within this evolving landscape.
Figure 1: WTI Oil Price vs. U.S. Dollar Index (1970–2015)
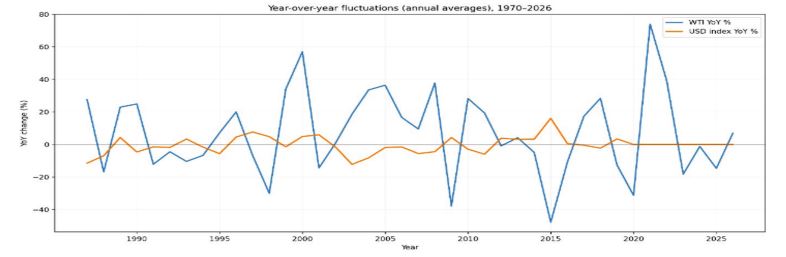
Figure.2: WTI Oil Price vs. U.S. Dollar Index (2015–2026): Breakdown of Inverse Relationship( when it is in PDF it cant)
2. HISTORICAL EVOLUTION OF THE PETRODOLLAR SYSTEM
The development of the petrodollar system can be understood across four broad phases, each shaped by distinct geopolitical and macroeconomic conditions.
Phase 1: Formation (1970s–1980s)
Following the breakdown of Bretton Woods, the United States entered into agreements with major oil producers — anchored by the pivotal 1974 U.S.–Saudi arrangement — to ensure that oil would be priced and settled in dollars. The oil shocks of 1973 and 1979 generated massive surpluses for oil-exporting countries, which were recycled into global financial markets. While this expanded liquidity and credit globally, it also contributed to inflationary pressures, the developing-world debt crisis of the 1980s, and structural adjustment programmes (Sachs, 1989; McKinnon, 1979; Krugman, 1984).
Phase 2: Consolidation (1990s–2008)
The system became deeply institutionalised during this period. Oil-importing countries accumulated dollar reserves as a matter of prudent reserve management; oil exporters invested heavily in U.S. Treasury securities and Western equities — contributing to the so-called ‘global saving glut’ (Bernanke, 2005) that compressed global interest rates. The petrodollar system served as a stabilising mechanism, enabling persistent U.S. current account deficits without triggering currency crises (Caballero et al., 2008; Kilian, 2009).
Phase 3: Transformation (Post-2008)
The global financial crisis exposed structural vulnerabilities in dollar-centric intermediation. Petrodollar recycling became increasingly linked to global imbalances and financial fragility. Sovereign wealth funds from oil-exporting countries began diversifying beyond traditional U.S. assets, reshaping global capital allocation (Eichengreen, 2011, 2019). The U.S. shale revolution and declining import dependence further weakened the structural incentive to maintain the dollar-oil nexus.
Phase 4: Emerging Transition (2020–2026)
Recent years have seen accelerated experimentation with non-dollar oil trade — most visibly between China and Russia, and increasingly with Gulf producers. Declining U.S. dependence on imported oil, the global energy transition toward renewables, and the weaponisation of dollar-based financial sanctions have collectively accelerated a shift toward a fragmented, multipolar global monetary order. The increasing adoption of the Chinese yuan in oil trading — known as the ‘Petroyuan’ — signifies not an abrupt break but a gradual move toward monetary multipolarity.
3. STRUCTURAL SHIFTS: THE RISE OF THE PETROYUAN
3.1 Structural Drivers
The petrodollar system faces mounting challenges from several converging sources. China, as the world’s largest energy importer, possesses both the capacity and the strategic incentive to encourage energy trade settlement in yuan. Western financial sanctions — particularly against Russia following the 2022 invasion of Ukraine, and against Iran — have redirected significant volumes of energy trade into non-dollar channels, with China acting as the principal alternative clearing hub. The 2024 BRICS+ expansion to include Saudi Arabia, UAE, Iran, Egypt, and Ethiopia has brought major oil producers into an institutional framework that explicitly endorses local-currency settlement (BRICS Summit, Johannesburg, 2023).
Three structural forces underpin this shift. First, geopolitical fragmentation: the use of dollar-based sanctions as a foreign policy instrument has incentivised sanctioned and sanction-averse states to develop alternative payment infrastructure. Second, China’s Belt and Road Initiative (BRI) has created a network of bilateral trade and financing relationships in which yuan denomination is increasingly normalised. Third, the development of China’s Cross-Border Interbank Payment System (CIPS) and the multi-CBDC mBridge platform provides functional technical infrastructure for non-SWIFT settlements.
3.2 Evidence of Petroyuan Expansion
Empirical evidence confirms a gradual but discernible shift. SWIFT data indicate that the yuan’s share of global payments increased from approximately 2% in 2015 to 4–5% in 2023–24. Bilateral trade between China and Russia now settles over 80% in yuan and rubles. By 2023, approximately 20% of worldwide oil transactions were settled in currencies other than the dollar, with the Chinese renminbi and Indian rupee holding the largest non-dollar shares (BRICS Policy Review, 2025).
The mBridge multi-CBDC platform — developed in collaboration with the Bank for International Settlements, the Hong Kong Monetary Authority, the Bank of Thailand, and the UAE central bank, with Saudi Arabia subsequently joining — reached its Minimum Viable Product (MVP) stage in June 2024 and processed transactions exceeding $55 billion by November 2025 (BIS, 2025). In 2023, Brazil and China established a bilateral currency swap framework worth 150 billion yuan, eliminating dollar intermediation in their bilateral trade.
3.3 Constraints on Petroyuan Expansion
The slow pace of Petroyuan expansion reflects structural constraints rather than lack of intent. China’s capital controls and limited yuan convertibility restrict the currency’s global circulation — individual annual foreign exchange conversions are capped at $50,000, and foreign investor access to Chinese financial markets remains regulated. The deep global entrenchment of dollar-based oil market infrastructure — where pricing benchmarks (WTI, Brent), derivatives contracts, and financial clearing mechanisms remain dollar-denominated — creates powerful network effects that are difficult to dislodge. Furthermore, the yuan’s managed exchange rate limits its appeal as a reserve asset for countries seeking freely tradable currency buffers.
The yuan’s share of global FX reserves has grown from approximately 1% in 2016 to nearly 3% in 2025 (IMF COFER, 2025) — meaningful growth, but far short of the dollar’s 57–58% share. Exchange rate management, capital account restrictions, and the absence of deep, liquid yuan-denominated sovereign bond markets comparable to U.S. Treasuries represent the binding constraints on yuan internationalisation for the foreseeable future.