
A synthesis of concepts, empirical evidence, international policy experience, and financing approaches
EXECUTIVE SUMMARY
Energy transition refers to long-term technological, fuel, infrastructure, market, institutional, and socio-cultural changes in how energy services are supplied and used. According to recent policy discussions, the term means transitioning away from an energy system based on fossil fuels towards increased efficiency, electrification, and decreasing emissions. The literature shows that transitions tend to be path-dependent and intensive in infrastructure. But new technologies can diffuse rapidly as soon as their cost falls if other conditions are met. Recent research provides evidence for four key propositions. First, the flow of clean energy investments is rising. Second, reliability depends on grid capacity, flexibility, and end-use efficiency. Third, finance and institutional risk matter in the case of emerging countries. Fourth, badly-managed distributional consequences could undermine the legitimacy of a transition process. International experience further indicates that targets are operationalized only if procurement processes, network planning, industrial capacity, finance tools, and social protection are considered. For Pakistan, the brief proposes a workable definition of energy transition in terms of the coordinated transition of energy supply, demand, networks, markets, finance, industry, and institutions. The criteria of success include affordability, reliability, energy security, financial sustainability, access, competitiveness, emission reductions, and distributive impact.
| STATE OF KNOWLEDGE: FIVE FINDINGS |
- Energy transition is a socio-technical system change, not a single fuel switch (Geels, 2002; Markard et al., 2012).
- Historical transitions are often slow, but policy-supported technologies can diffuse much faster (Smil, 2010; Sovacool, 2016).
- Low technology costs do not remove the need for grids, flexibility, bankable contracts and capable institutions (IEA, 2023; IRENA, 2026b).
- High costs of capital can outweigh technology cost advantages in emerging and developing economies (IEA, 2024).
- Benefits and burdens are unevenly distributed, making justice and participation central to implementation (Carley & Konisky, 2020; ILO, 2015).
ENERGY TRANSITION AS SYSTEM TRANSFORMATION
| SUPPLY | DEMAND | NETWORKS | MARKETS | FINANCE | PEOPLE & INSTITUTIONS |
| Low-carbon resources | Efficiency & electrification | Grids, storage & flexibility | Prices, procurement & rules | Risk allocation & capital | Skills, access, participation |
Source: synthesis of Geels (2002), IPCC (2022), IEA (2023) and IRENA (2024)
Outcomes are jointly evaluated based on affordability, reliability, security, access, competitiveness, and emissions.
WHY TRANSITION IS CRITICAL NOW
| Dimension | What the literature establishes | Source |
| Climate and health | Energy production and use account for the dominant share of greenhouse-gas emissions and are major sources of local air pollution. | IPCC (2022) |
| Security and macro stability | Fuel-import dependence exposes economies to geopolitical disruption, price shocks, subsidies and foreign-exchange pressure. Efficiency and domestic clean supply can reduce this exposure. | IEA (2022); IRENA (2026b) |
| Growth and competitiveness | Electricity quality, energy productivity, carbon intensity and access to green finance increasingly shape industrial costs, trade and investment. | IRENA (2024); World Bank (2023) |
Energy transition matters because it is simultaneously an environmental, security and development issue.
1. Introduction: Purpose, Scope and Limitations
Energy systems in the world are being transformed under certain pressures including climate commitments, fuel-price volatility, technological learning, industrial competition and rising electricity demand. This Knowledge Brief aims to synthesize the literature on energy transition to understand its meaning. Furthermore, it attempts to answer certain questions. These include what empirical evidence establishes with reasonable confidence, which issues remain contested, and what international experience implies for Pakistan. Thus, it is equally relevant to researchers, practitioners and informed policy audiences.
| SCOPE AND LIMITATIONS |
| The brief covers system-wide transition, focusing on electricity, end-use efficiency, finance and just-transition concerns. It synthesises peer-reviewed research, major international assessments and official policy documents. However, it does not evaluate any lowest-cost path for Pakistan, analyze the project-based funding needs, or view the selected country case studies as replicable. This is because the institutional capabilities, resource bases, and development priorities differ between countries. |
2. Definitions and Theoretical Foundations
Historically, energy transition has been understood as a transformation involving fuel sources, conversion technologies, and energy-use patterns. Following this, the sustainability transitions literature further elaborates on this notion by defining energy provision as a socio-technical system where technological artifacts relate to infrastructure, regulation, firms, consumers/users, skills, and social conventions (Geels, 2002; Markard et al., 2012). The multi-level perspective explains transitions through interactions between protected innovations – “niches,” existing systems – “regimes,” and wider economic, political, and ecological dynamics. Such an approach provides an understanding of why the simple availability of more affordable technology is often insufficient to overcome existing asset stocks and contractual/behavioral relationships.
Table 1: Key Concepts and Their Meaning in the Energy Transition Literature
| Concept | Meaning in this brief | Knowledge anchor |
| Energy transition | Long-term transformation of energy supply, conversion, networks, demand, markets, institutions and practices. | Smil (2010); Markard et al. (2012) |
| Decarbonisation | Reduction in carbon intensity and absolute emissions; a major objective, but not the full transition. | IPCC (2022) |
| Renewable expansion | Deployment of replenishing sources such as solar, wind, hydro, geothermal and sustainable bioenergy. | IRENA (2024) |
| Electrification | Substitution of direct fuel use with electricity in transport, heat, buildings and industry where technically and economically suitable. | IEA (2021) |
| Net zero | Balance between anthropogenic greenhouse-gas emissions and anthropogenic removals over a specified period. | IPCC (2022) |
| Just transition | A process that anticipates effects on workers, consumers, communities and regions and embeds participation, decent work and social protection. | ILO (2015); Carley & Konisky (2020) |
Related concepts should not be used interchangeably.
| WHY THEORETICAL FRAMING MATTERS |
Three propositions follow. First, transition is path-dependent: existing plants, grids, subsidies, contracts and skills shape feasible choices. Second, it is multi-sectoral: power-sector decarbonisation enables but does not complete transition in transport, buildings and industry. Third, it is political and distributive: incumbent firms, consumers, workers and regions have different exposure to costs and benefits. These propositions caution against treating transition as an engineering capacity target alone.
Table 2: Analytical Lenses for Understanding Energy Transitions
| Analytical lens | Core question | Value for policy analysis |
| Historical systems lens | Examines shifts among fuels, technologies and infrastructures over long periods. | Clarifies inertia, scale and the role of sunk assets. |
| Multi-level perspective | Explains interaction among innovations, established regimes and wider economic or political pressures. | Shows why niches need markets, networks and institutional change to scale. |
| Political-economy lens | Focuses on interests, rents, ownership, subsidies, state capacity and coalitions. | Explains resistance, policy instability and differences between formal targets and delivery. |
| Energy-justice lens | Assesses distributional, procedural and recognition dimensions of change. | Makes affordability, participation, workers and affected regions part of transition design. |
Complementary theoretical lenses used in energy-transition research.
| WHAT THEORY DOES NOT IMPLY |
| The literature does not identify a universal fuel mix, an optimal pace or a specific institutional model. It instead identifies recurring mechanisms (learning, lock-in, coordination, risk allocation and distribution) that need to be tested against each country’s resource base, demand trajectory and administrative capacity. |
3. What Does Empirical Evidence Show?
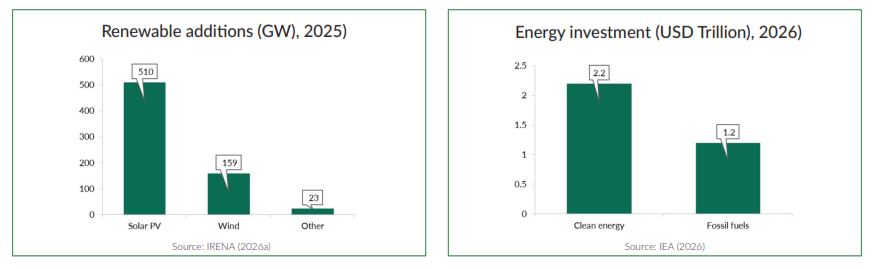
Recent data show a strong reallocation of global capital and capacity toward clean technologies, but not a uniform transition. IRENA reports that 692 GW of renewable power was added in 2025, accounting for 85.6 percent of all power capacity additions; 79.5 percent of new renewable capacity was concentrated in China, the United States and the European Union (IRENA, 2026a). The IEA estimates global energy investment at USD 3.4 trillion in 2026, with USD 2.2 trillion directed to clean energy and USD 1.2 trillion to fossil fuels (IEA, 2026).
Figure 1: Global Transition Momentum is strong, but unevenly distributed
Technology economics have also changed. In 2025, global weighted-average levelised costs were about USD 33/MWh for onshore wind and USD 44/MWh for utility-scale solar PV, while more than 90 percent of new utility-scale renewable projects were cheaper than the lowest-cost new fossil-fuel alternative. Four-hour battery installed costs fell to around USD 140/kWh, but financing conditions and grid availability increasingly explain cross-country differences in delivered costs (IRENA, 2026b). Way et al. (2022) similarly find that conventional models have often underestimated learning-driven cost declines in solar, wind, batteries and electrolysers.
Table 3: Areas of Consensus and Continuing Debate
| Issue | Broad consensus | What remains contested |
| Pace of transition | System-wide transitions are path-dependent and infrastructure-intensive. | How rapidly policy can compress transition timelines without creating reliability, fiscal or social stress. |
| Technology costs | Solar, wind and batteries have experienced substantial learning and cost declines. | Future supply-chain, financing and integration costs; appropriate roles for nuclear, gas, hydrogen and carbon capture. |
| Grid and flexibility | Transmission, distribution, storage, interconnection and demand response are essential complements to variable renewables. | Optimal mix of storage, flexible generation, regional trade and demand-side measures in each system. |
| Finance | Policy stability, credible offtakers, currency risk and project preparation materially affect the cost of capital. | How much concessional finance is needed and how effectively it mobilises additional private capital. |
| Distribution | Transitions create winners and losers across households, workers, firms and regions. | Which compensation, participation, and regional development arrangements deliver durable fairness? |
| Energy security | Efficiency and domestic clean energy resources can reduce exposure to imported fuel. | New vulnerabilities related to minerals, equipment concentration, cyber risks, and weather-dependent supply. |
Table 4: Evidence Beyond Capacity Additions
| Evidence domain | What is known | Interpretation |
| Integration | The IEA estimates that around 80 million kilometres of grids may need to be added or replaced globally by 2040 to meet national goals. | Network planning is a transition investment, not a secondary technical issue. |
| Finance | In emerging and developing economies, financing can make up half or more of solar PV levelised costs; energy-sector risks explain part of the premium. | A low equipment price does not guarantee low delivered electricity cost. |
| Distribution | Research documents uneven exposure to energy bills, job displacement, environmental burdens and access to new opportunities. | Aggregate gains can coexist with concentrated losses and political resistance. |
| System security | Renewables reduce recurring fuel exposure, while variability, supply-chain concentration and critical-mineral dependencies create new risk-management needs. | Security should be assessed across fuels, infrastructure, technology and institutions. |
Deployment statistics are necessary but insufficient measures of transition progress.
3.1 Forward Outlook: Electricity Demand, Supply Mix and Pakistan Scenarios
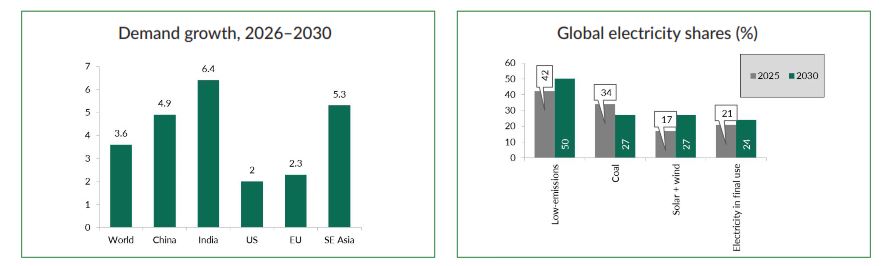
The forward outlook strengthens the central finding of this brief: the transition is occurring alongside faster electricity-demand growth, rather than through declining energy-service needs. The IEA projects global electricity demand to expand by an average of 3.6 percent a year during 2026-2030, raising consumption from about 28,200 TWh in 2025 to 33,600 TWh in 2030. Growth is expected to be particularly strong in India, Southeast Asia and China. At the same time, demand resumes sustained growth in the United States and the European Union because of data centres, cooling, electric mobility, heat pumps and industrial electrification (IEA, 2026b).
Figure 2: Global electricity outlook to 2030: demand growth and changing generation shares
Source: IEA (2026b)
On the supply side, low-emissions sources (renewables and nuclear) are forecast to account for 50 percent of global electricity generation by 2030, up from 42 percent in 2025. The combined share of solar PV and wind rises from 17 percent to 27 percent. Coal’s share falls from 34 percent to 27 percent. Furthermore, the IEA forecasts 4,600 GW of renewable capacity additions during 2025-2030, including 80 percent solar PV. These projections also highlight the infrastructure constraint: annual grid investment needs to rise by roughly 50 percent from the current level of about USD 400 billion (IEA, 2025; IEA, 2026b).
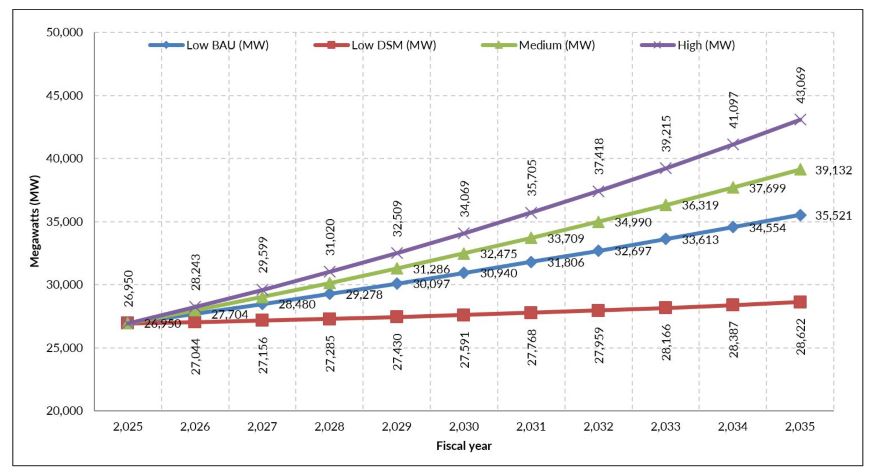
Planning scenarios in Figure 3 show why uncertainty must be explicit. According to the Revised IGECP 2025-2035, the peak national demand in FY2035 is estimated at 28.6 GW in the Low demand-side management (DSM[1]) scenario, 35.5 GW in the Low business-as-usual (BAU[2]) scenario, 39.1 GW in the Medium Growth scenario, and 43.1 GW in the High Growth scenario. The difference between the minimum and maximum estimates equals 14.4 GW, which is large enough to have significant implications for generation, transmission, reserve, and financing requirements (Government of Pakistan, NEPRA, 2025).
Figure 3: Pakistan peak-electricity-demand scenarios, FY2025–FY2035
Source: Revised IGCEP 2025–2035
Table 5: Low-BAU Country Energy Demand before and after the IGCEP Net-Metering Adjustment
| Fiscal year | Gross demand (GWh) | After net metering (GWh) | Difference (GWh) |
| 2025 | 137,025 | 133,233 | 3,792 |
| 2030 | 157,313 | 146,454 | 10,859 |
| 2035 | 180,605 | 167,293 | 13,312 |
Source: Government of Pakistan, NEPRA (2025)
It is important to note that the introduction of net metering requires a proper understanding that although energy produced beyond the meter reduces demand recorded or served by the interconnected grid system, it does not eliminate the inherent demand for energy services. This implies that there will be a need for a dual planning approach.
4. Comparative and International Perspectives
International experience is most valuable when considered through comparative analysis. The industrialized countries usually have well-developed capital markets and administrative capabilities. At the same time, emerging and developing countries have to deal with the issues of fast-growing demand, underdeveloped utilities, high levels of sovereign and exchange risks, and challenges related to affordability and accessibility. Therefore, the important point is not which model should be followed by Pakistan, but which design features persist under different situations.
Table 6: Selected Developed- and Developing-Country Experiences
| Country | Policy architecture | Main instruments | What the case adds to knowledge |
| Germany Developed |
Climate Change Act; renewable-electricity legislation; climate-neutrality goal for 2045. | Long-term legal direction, renewable auctions, grid planning, efficiency, industrial support and public-bank finance. | Durable targets need permitting, network expansion and attention to costs in buildings, transport and industry. |
| United Kingdom Developed |
Climate Change Act and carbon budgets; Contracts for Difference; Clean Power 2030 Action Plan. | Independent carbon governance, competitive long-term contracts, regulated networks and connection reform. | Accountable milestones and bankable procurement can mobilise capital, but grid queues and system balancing remain binding. |
| China Emerging |
Carbon-peaking and neutrality framework; 2024 energy-transition white paper. | State-led grids, manufacturing scale, electrification, renewables, storage and green finance. | Industrial capability and infrastructure accelerate diffusion; continued coal investment illustrates security and lock-in tensions. |
| India Developing |
Renewable auctions and obligations; Green Energy Corridors; National Green Hydrogen Mission. | Competitive procurement, transmission support, open access and targeted industrial incentives. | Predictable demand creation can crowd in private capital, but rapid load growth and financing needs complicate substitution. |
| South Africa Developing |
Just Transition Framework and Just Energy Transition Investment Plan 2023–2027. | Grid investment, coal-region diversification, skills, municipal capacity and blended international finance. | Utility viability, local jobs and regional development need to be embedded in the investment plan. |
| Viet Nam Developing |
Power Development Plan VIII and Just Energy Transition Partnership (JETP) Resource Mobilisation Plan. | Renewable and network expansion, market reform, project pipeline and international partnership finance. | Large pledges do not automatically become investment; project bankability, terms and domestic reform determine delivery. |
Sources: official country policy documents listed in the references.
4.1 Country Cases in Practice: From Policy Design to Delivery
Comparative analysis of countries helps identify how the energy transition can be implemented successfully. As follows from the examples presented below, there is an evident difference between the policy instrument used for triggering the energy transition and the constraint generated when implementing the first step. It becomes evident that any energy-transition policy must necessarily be iterative; solving one constraint (e.g., price and investment risks) and facing the next (network constraints).