1 Introduction
Global trade is becoming more regional. Tariff tensions between the United States and China, disruptions to shipping routes, and the rise of “friend-shoring” are encouraging firms to place more stages of production closer together. Regional value chains divide design, sourcing, production and assembly across neighbouring economies. They are gaining importance within the wider trading system. Cross-border value chains already account for a large share of world trade.[1] For Pakistan, positioned between South Asia, Central Asia, China and the Middle East, the question is no longer whether regional integration matters, but whether the country will participate in these chains as a genuine value-adding partner or remain, as it largely has, a peripheral transit point collecting gateway rents while its neighbours capture the manufacturing and services value upstream and downstream. This article explains where Pakistan stands, why regional integration remains weak, and what policy must change.
2 How Much Does Pakistan Trade with Its Region?
2.1 A Region That Barely Trades with Itself
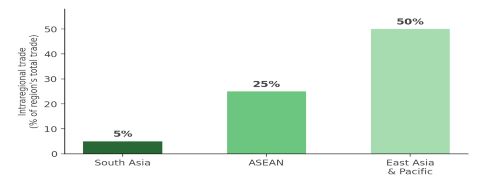
South Asia is one of the least integrated regions in the world. Trade within the region is only about 5 percent of its total trade. The comparable regional trade share is about 25 percent in ASEAN and close to 50 percent in East Asia and the Pacific (WB, 2018). Pakistan follows the same pattern. Trade with its South Asian neighbours is only about 8 percent of its total trade, despite its location in a fast-growing region.[2] [3]
Figure 1: Intraregional trade as a share of each region’s total trade. Source: World Bank, South Asia Regional Integration Program.
Source: World Bank, South, South Asia Regional Integration Program, “Trade” (worldbank.org)
Table 1: Pakistan and South Asia’s Regional Trade Gap
| Indicator | Value | Source |
| Intraregional trade share, South Asia | Approximately 5% of total trade | Kathuria & Mathur[4]. (2019). |
| Intraregional trade share, ASEAN | Approximately 25% of total trade | World Bank |
| Pakistan’s trade with South Asia | Approximately 8% of Pakistan’s global trade | World Bank (2018) |
| South Asia average applied tariff | 13.6%, 2x greater than the world average | World Bank (2018) |
| Pakistan’s regional trade covered by SAFTA sensitive lists | Approximately 20% of imports and 39% of exports | World Bank (2018) |
| Container shipping cost premium vs OECD | 50% higher than OECD | World Bank (2020)[5] |
| Estimated annual intraregional trade gap | US$44 billion | World Bank |
2.2 Pakistan’s Position in Global and Regional Value Chains
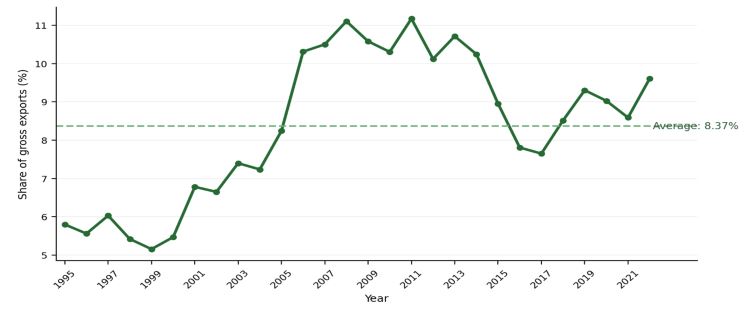
Pakistan’s economy-wide TiVA data reveal a GVC structure that is consistently more forward than backward-oriented. Backward participation captures foreign value added embodied in Pakistan’s exports, while forward participation captures Pakistani value added embodied in other economies’ exports. During 1995–2022, backward participation averaged 8.37 percent, forward participation averaged 15.20 percent, and their combined total averaged 23.56 percent of gross exports. Forward participation exceeded backward participation in every year, indicating that Pakistan entered global production networks more strongly as a supplier of domestic value added than as a user of foreign inputs.
Figure 2: Pakistan: Backward BVC participation (1995 – 2022)
Source: Author’s calculations based on OECD TiVA data, Total – All activities.
Figure 3: Pakistan: Forward BVC participation (1995 – 2022)
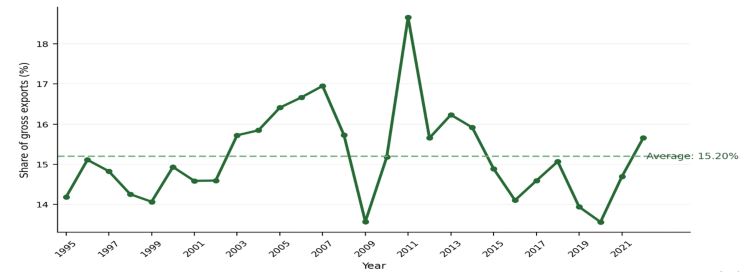
Source: Author’s calculations based on OECD TiVA data, Total – All activities.
The distinction matters because backward participation can support productivity, technology transfer and product upgrading through access to better intermediate inputs. Forward participation can also reflect productive specialisation, but when it is concentrated in raw or lightly processed goods, it may keep the country in low-value activities with limited employment generation and weak pricing power.
The sectoral pattern sharpens this picture. Backward participation is highest in import-dependent, capital- and energy-intensive sectors such as coke and refined petroleum at 41.1 percent, basic and fabricated metals at 24.9 percent, chemicals at 24.4 percent, machinery at 23.0 percent, and electronics and electrical equipment at 22.4 percent. These sectors rely heavily on imported fuel, materials and components, largely to serve domestic demand. In contrast, textiles and apparel—Pakistan’s main export sector—have a backward participation rate of only 7.6 percent (WB 2020). This suggests that the sector relies mainly on domestic inputs and makes limited use of imported fibres, dyes, machinery, trims and other specialised inputs that could support higher-quality production.
Figure 4: Pakistan’s backward GVC participation by sector, 2022.
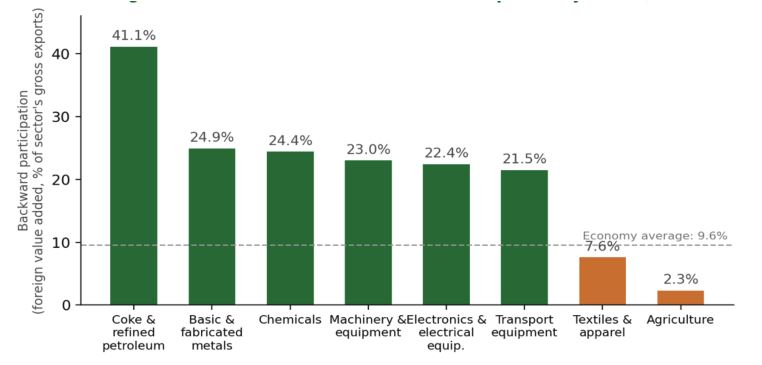
Source: Author’s calculations from OECD TiVA database (EXGR_FVASH).
Forward participation shows the reverse pattern. Textiles and apparel contribute 3.0 percent of Pakistan’s total gross exports through domestic value added embodied in other countries’ exports, well above electronics at 1.3 percent, food products at 1.1 percent, transport equipment at 1.1 percent, and chemicals at 1.0 percent. Pakistan’s strongest international production link therefore runs through cotton, yarn, fabric and other intermediate textile products supplied to foreign apparel industries. This creates export earnings, but it also indicates that Pakistan remains concentrated in upstream and semi-processed stages rather than higher-value functions such as advanced finishing, technical textiles, design, branding and distribution.
Figure 5: Pakistan’s forward GVC participation by sector, 2022.
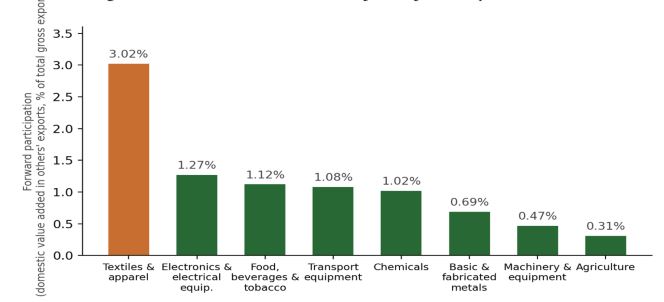
Source: Author’s calculations from OECD TiVA database (EXGR_DVAFXSH).
Pakistan’s regional links are similarly uneven. China and the Gulf are important sources of machinery, energy and intermediate goods, while Central Asian trade remains commercially small and South Asian integration is weak relative to geographical proximity. Pakistan is therefore connected to the region mainly through imports, while much of its export revenue and domestic value added is realised in markets outside the region.
Table 2: Benchmarks for Pakistan’s regional trade and value-chain corridors
| Partner corridor | Available benchmark | Period | Value-chain reading |
| South Asia | About 8% of Pakistan’s global trade | 2018 benchmark | Low for a neighbouring region; indicates weak production sharing and market integration. |
| China | US$19.76 billion total goods trade (exports US$2.37bn; imports US$17.39bn) | FY2024-25 | Large, import-heavy sourcing corridor; machinery, components and investment links dominate reciprocal export integration. |
| Central Asia (five republics) | About US$0.40 billion total trade | FY2024-25/current | Commercially small despite transit ambitions; scope exists for agro-processing, energy and logistics chains. |
| Middle East region (broader Gulf-oriented proxy) | US$18.77 billion total trade (exports US$3.21bn; imports US$15.56bn) | FY2024-25 | Import-heavy energy corridor; demand for textiles, food and services offers underused outward opportunities. |
Sources and notes: South Asia benchmark from World Bank (2018); China calculated from Pakistan Bureau of Statistics FY2024-25 total exports/imports and country shares; Central Asia calculated from Ministry of Foreign Affairs bilateral figures for Kazakhstan, Kyrgyz Republic, Tajikistan, Turkmenistan and Uzbekistan; Middle East from Ministry of Commerce, Year Book 2024-25. These are gross-trade benchmarks, not bilateral TiVA values. Reporting periods and regional definitions differ, so the rows are not additive.
The policy challenge is to convert these trade corridors into genuine production-sharing relationships. Chinese investment and machinery should strengthen local supplier capabilities; Gulf demand should be linked to processed food, textiles and tradable services; Central Asian corridors should support two-way agro-industrial, logistics and energy chains; and South Asian trade arrangements should allow cumulative rules of origin across cotton, yarn, fabric, chemicals and garments. The success of regional integration should be judged by whether it increases domestic processing, skilled employment, services content and value capture—not merely imports, transit traffic or gross export volumes.
3 – Four Frictions Holding Pakistan Back
Recent official evidence sharpens rather than changes the diagnosis. Pakistan’s exporters face four mutually reinforcing barriers: high and complex border taxation, costly and unpredictable compliance, weak trade logistics, and political or policy uncertainty. Together they raise the cost of imported inputs, interrupt time-sensitive production and discourage firms from forming repeated regional supplier relationships.
3.1 – Tariffs and Para-Tariffs
Pakistan’s tariff regime has historically taxed production inputs as well as final goods. The National Tariff Policy 2025–30 reports a 10.3 percent simple-average MFN applied tariff, together with average additional customs duties of 3.65 percent and regulatory duties of 4.57 percent. The World Bank reports that para-tariffs pushed average import protection close to 20 percent and that 30.9 percent of exporters identify tax rates as their largest obstacle. The productivity cost is measurable: a 1 percent increase in upstream protection is associated with a 0.6 percent decline in downstream productivity. For regional value chains, such protection makes fibres, chemicals, machinery and components more expensive and reinforces the incentive to sell into the protected domestic market rather than export.[6]
3.2 – Non-Tariff Barriers
Non-tariff barriers are often procedural rather than openly prohibitive. Sanitary and phytosanitary requirements, technical regulations, pre-shipment inspection, non-automatic licensing and price controls can all delay inputs even when formal tariffs are low. The World Bank estimates that documentary and border compliance requires about 127 hours and US$468 in South Asia, compared with 96 hours and US$384 in South-east Asia. Pakistan-specific firm evidence points in the same direction: 17.9 percent of exporters identify customs and trade regulations as their largest obstacle. These costs fall particularly heavily on smaller firms and on production stages that depend on rapid, repeated cross-border deliveries.[7]
3.3 – Connectivity and Logistics Costs
Physical corridors do not create value chains unless shipments are predictable, traceable and competitively priced. The World Bank’s (2025) Pakistan Development Update states that customs-management and logistics costs remain high and identifies inefficient trade facilitation, unreliable energy and insufficient digital infrastructure as constraints on export competitiveness. The OECD data illustrate the scale of the established sourcing pattern: Pakistan imported US$21.67 billion from Eastern and South-eastern Asia in 2022 but exported only US$5.53 billion there. This imbalance does not prove that logistics alone caused the pattern, but it shows the depth of Pakistan’s dependence on distant, established supply networks. Regional suppliers will compete only if border clearance, inland transport, energy and information systems become equally reliable.[8]
3.4 – The Trust Deficit and Policy Uncertainty
Value chains depend on repeated contracts and confidence that borders, transit routes and trade rules will remain open. The World Bank’s Glass Half Full report estimates that South Asian trade is only about one-third of its potential and identifies discriminatory policies and a persistent trust deficit as central causes. In Pakistan, 12.4 percent of exporters identify political instability as their largest obstacle. Sudden border restrictions, route closures and policy reversals raise the expected cost of nearby sourcing, so firms may prefer more distant but predictable partners even when geographic distance is shorter. Functional agreements on transit, payments, standards and dispute resolution can reduce this commercial risk without waiting for every political dispute to be resolved.[9]
Opportunities to build regional value chains
CPEC and Gwadar: CPEC and Gwadar Port remain Pakistan’s strongest connectivity asset. The focus is now shifting toward “CPEC 2.0.” This means special economic zones, industrial relocation, and agricultural cooperation, not just roads and power plants. This is the right shift. But one question remains: will these zones supply parts to Chinese and regional manufacturers? Or will they simply repeat Pakistan’s old pattern of low-value assembly for export?[10]
Textiles: Textiles are Pakistan’s most naturally regional sector. Studies show that cotton, yarn, fabric, and garments already move across South Asian borders in practice, even where formal trade policy has not caught up.[11] Pakistan has a strong cotton and yarn base. This gives it a real chance to supply a regional textile chain that today trades far below its potential.
Agriculture and Agro-Processing: Agriculture and agro-processing offer a second opening, especially toward Central Asia and the Gulf. Pakistan can supply more than raw commodities. It can supply processed and packaged agri-goods, if it builds better cold-chain and quality-standard infrastructure. This also fits well with the industrial-competitiveness and energy themes running through this issue.
Overland Transit Trade: Overland transit trade is a third lever, and it remains underused. India is already building the International North-South Transport Corridor. This route links Central Asia, Iran, and Russia to global markets without passing through Pakistan. To stay competitive, Pakistan needs to modernise its own transit trade deals with Afghanistan and the Central Asian Republics. Otherwise, Gwadar and Pakistan’s northern land routes risk being bypassed altogether.[12]
A Reform Agenda Beyond Flagship Projects
Turning assets into real value chains needs more than one big project. Five reforms matter most.
Fix SAFTA’s sensitive lists and cut para-tariffs on intermediate goods. Push for cumulative rules of origin, so inputs from several regional partners can count toward preferential treatment. This one change would do the most to make regional sourcing competitive.
Invest in trade facilitation, not just ports and highways. Strengthen single-window customs clearance. Recognise product standards and testing across borders. Build dedicated freight corridors linking industrial clusters to land borders.
Make special economic zone according to policy demands. Plan zones and research must be conducted around real, documented gaps in Chinese and regional supply chains. Tie incentives to local value addition, not to export volume alone.
Modernise transit trade deals with Afghanistan. Build stand-alone trade and transit arrangements with the Central Asian Republics that do not depend on progress in India-Pakistan relations.
Build those institutions and data systems, which are needed in reform agenda. Set up a standing regional value chain unit inside the Ministry of Commerce. Use real value-added trade data, not just gross export figures.
Iqra Karamat is a PhD Scholar at the Pakistan Institute of Development Economics (PIDE), Islamabad.
Uzma Zia is a Senior Research Economist at the Pakistan Institute of Development Economics (PIDE), Islamabad.
[1]Bhusal, L. B. (2025). “South Asian global value chain integration patterns: A value-added perspective.” Asia and the Global Economy, 5(2), 100110. The article cites an OECD estimate that global value chains account for about 70 percent of world trade.
[2]World Bank. “Trade.” South Asia Regional Integration Program. Intraregional trade is about 5 percent of South Asia’s total trade, compared with roughly 25 percent in ASEAN. The region trades about US$23 billion internally against an estimated potential of at least US$67 billion.
[3]World Bank (2018). “Pakistan’s Trade with South Asia Can Rise Eight-Fold.” Pakistan’s trade with South Asia is about 8 percent of its global trade. Intraregional trade in South Asia is about 5 percent, compared with 50 percent in East Asia and the Pacific.
[4] Kathuria, S., & Mathur, P. (2019). How Can South Asia Turn Its Proximity from a Burden to an Advantage. World Bank Other Operational Studies.
[5] https://mail.google.com/mail/u/1/#inbox/FMfcgzQhVhZVXDgtFJBLXfTZrdgzRDvZ?projector=1&messagePartId=0.1
[6] Ministry of Commerce, Government of Pakistan (2025). National Tariff Policy 2025–30. The policy reports a 10.3 percent simple-average MFN applied tariff, average additional customs duties of 3.65 percent and average regulatory duties of 4.57 percent. World Bank (2025), Pakistan Development Update: Staying the Course for Growth and Jobs, reports that para-tariffs pushed average protection close to 20 percent, that 30.9 percent of exporters identify tax rates as their largest obstacle, and that a 1 percent increase in upstream protection is associated with a 0.6 percent decline in downstream productivity.
[7] World Bank (2022). Deepening Linkages between South Asia and Southeast Asia. The report identifies sanitary and phytosanitary measures, technical regulations, pre-shipment inspection, non-automatic licensing and price controls as barriers, and estimates documentary and border compliance at 127 hours and US$468 in South Asia versus 96 hours and US$384 in South-east Asia. World Bank (2025), Pakistan Development Update: Staying the Course for Growth and Jobs, reports that 17.9 percent of Pakistani exporters identify customs and trade regulations as their largest obstacle.
[8] World Bank (2025). Pakistan Development Update: Staying the Course for Growth and Jobs. The report states that customs-management and logistics costs are high and identifies inefficient trade facilitation and logistics, unreliable energy supply and insufficient digital infrastructure as constraints on export competitiveness and GVC integration. OECD TiVA 2025 data show that Pakistan imported US$21.67 billion from Eastern and South-eastern Asia and exported US$5.53 billion there in 2022.
[9] World Bank (2018). A Glass Half Full: The Promise of Regional Trade in South Asia; the report estimates that actual intraregional trade is about one-third of its potential and identifies discriminatory policies and the trust deficit as central barriers. World Bank (2025), Pakistan Development Update: Staying the Course for Growth and Jobs, reports that 12.4 percent of Pakistani exporters identify political instability as their largest obstacle.
[10]PIDE Discourse (2025). “CPEC Extensions: How Pakistan Can Get More from Bilateral Transit Agreements?” and “A Decade of CPEC – Lessons, Challenges, and the Road Ahead,” Pakistan Institute of Development Economics.
[11]World Bank (2019). “The Textile-Clothing Value Chain in India and Bangladesh.” South Asia Regional Integration Program publications.
[12]PIDE Discourse (2025), op. cit. “CPEC Extensions: How Pakistan Can Get More from Bilateral Transit Agreements?”