A Critical Appraisal of Tax Expenditures in Pakistan
A Critical Appraisal of Tax Expenditures in Pakistan
Mahmood Khalid and Naseem Faraz, Pakistan Institute of Development Economics, Islamabad.
PTI Government presented a balanced budget for FY2021-22 under tough economic conditions with an aim to achieve GDP growth and manage fiscal balance. The outlay of budget for FY 2021-22 stood at Rs 8.49 Trillion, up 19% from revised numbers of previous year. Higher expenditures have not been matched by higher taxes though for the same period. Tax collection by FBR has increased by 9.92% in FY2021 over the last year. However it is a good tax revenue growth despite economic collapse of last year, but, a lot needs to be done on the tax policy side, especially, the concessionary regime extended. This resulted in need for a supplementary finance bill after the IMF 6th Review Mission – October 4-19, 2021. It is reported that the demand of IMF was Rs 700 Billion in lieu of GST Tax expenditures reduction which was conceded upto Rs 343 Billion. These concessions are often criticised for being influenced by the lobbying and rent seeking segments(Ahmed, 2019). PIDE has been repeatedly suggesting key reforms in the overall tax Policy regime thus making it conducive for growth (see PIDE, 2020; 2021).
Governments throughout the world use tax expenditures (TE) as an alternative policy option to achieve social objectives and promote economic growth. However, optimum use and good administration of tax expenditure policy is crucial for achieving these desired goals. Hence, comprehensive reporting on revenue lost and evaluation of cost and benefit is prerequisite for fiscal governance in this case.
In case of Pakistan, tax expenditures are defined as, “the tax revenue loss resulting from those preferential provisions of law that provide certain taxpayers/class of taxpayers or sectors and that results in the collection of less tax revenue than would be the case otherwise” (Ahmed & Ather, 2014). Tax expenditures are revenue not collected owing to special tax provisions in the tax law that are exceptions to the normal structure of the tax system. They represent the revenue which government forgoes from these tax provisions, to achieve various social and economic objectives by favouring a particular industry, activity, or class of persons. Hence, tax expenditures are an alternative for the government to achieve its policy objectives through the tax system, instead of direct spending, grants, loans, or other forms of government assistance.
There are concerns that revenue in Pakistan is raised in an inefficient way and it’s marred with rent seeking. This issue is further exacerbated in case of the tax expenditures. The assessment of tax expenditures is often complicated because reporting and accounting practices fall far short of what is used for official government expenditures, which makes it difficult, if not impossible, to evaluate the cost, efficiency and distributional impact of tax expenditures[1]. Under the PFM Act 2019 now Pakistan government is committed to increase the transparency of tax policy as well. As a statutory requirement, now FBR tables a detailed estimates of tax expenditures along with the budget proposal in parliament for approval.
In this brief, we have presented a critical appraisal of tax expenditures which appears to be contradictory to all the claims made by successive finance ministers regarding exemptions. Tax expenditures are on the rise and no economic evaluation has been carried out so far to evaluate the outcomes or even the objectives of these tax expenditures.
DESCRIPTIVE ANALYSIS
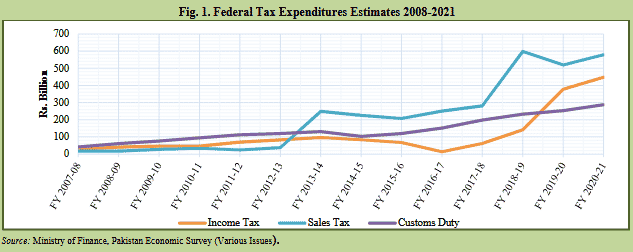
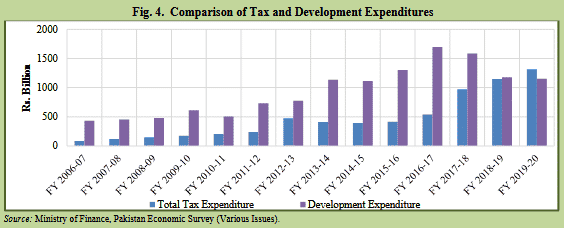
Tax expenditures increased by 164.322 billion (14.28%-higher than the growth of tax revenues) in FY 2020-21[2] from last year. In FY 2020-21 tax expenditures are reported to be Rs 1314.273 billion, 33% of total tax collection and 2.75% of total GDP while they were reported at Rs 1149.951 billion in FY 2019-20, 30% of total tax collection and 3.15% of total GDP. The same figures for FY 2007-08 were just 8.6% of the total tax collection and 0.85% of the GDP. This raises the question of what are the goals for such higher level of spending over time and how much of these have been achieved so far.
Tax expenditures are estimated for the three main categories of Federal taxes collected by FBR i.e. Income Tax, Sales Tax and Custom Duty. From Figure 1 above it is evident that there is a perpetual growth in all the three types of tax expenditures. However Sales Tax and more recently Income tax related tax expenditures are growing at a faster pace. For the FY 2020-21 share of Income tax expenditure in total tax expenditure was 34.1%, for Sales Tax expenditures it was 44% and for Customs it was 21.9%. These ratios for FY 2006-07[3] were 31.9%, 20.3% and 47.8% respectively. This shows a clear shift in policy, if there is any towards facilitating the domestic businesses.
____________________________________
Authors’ Note: We acknowledge research assistance provided by Mr Saud Abdullah (MPhil Economics and Finance Scholar, PIDE).
[1] The tax expenditure estimates are unadjusted amounts, meaning that elimination or repeal of a specific exemption would not necessarily produce the rupee amounts cited in reports as revenues. Actual receipts would depend on enforcement, taxpayer compliance, effective dates of legislation repealing the exemption, exact wording of any legislation, taxpayer’s behavior, and other economic factors.
[2] FY stands for Fiscal Year, which means financial year starting from July 1st and ending on June 30th. Tax expenditures are estimated for a closed financial year. Although June 30th is the last date but return filing is beyond that period so the year previous to that is used for reporting TE. For example TE report for FY2020-21 used data upto June 30, 2020. Covid out break and corresponding fiscal measures had more impact in the FY 2020-21 starting from 1st July, 2020.
[3] The data for tax expenditures is available from FY 2006-07 and reported in Economic Survey of Pakistan report by M/O Finance.
ECONOMIC COST AND BENEFIT OF TAX EXPENDITURES
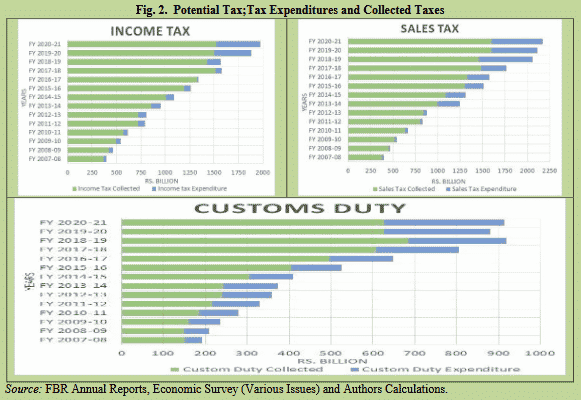
Figure 2 above shows the total potential revenue from three taxes; Federal Income Tax, Federal Sales Tax and Customs respectively (i.e. actual taxes collected and tax expenditures combined for each respective tax). Tax expenditures as a proportion of tax collected have increased over the years. If we look at the potential tax revenue (i.e. tax expenditures and total tax collected combined) then for income tax it is close to 2 trillion rupees (Rs 0.5 trillion and Rs 1.5 trillion respectively), for sales tax its approximately 2.2 trillion rupees (Rs 0.6 trillion and Rs 1.6 trillion respectively) and for customs its more than 900 billion rupees (Rs 288 billion and Rs 626 billion respectively). It appears that in the past three fiscal years, about one-third of total tax revenue which could have been collected is forgone in lieu of tax expenditures. Now given a substantial increase in tax expenditures the questions here arise that what purpose these concessions and exemptions serve? Are they contributing to the achieve the intended economic goals if any or not? Why is the growth in tax expenditures more than the total tax collected for the same period? Is there an upper limit of these tax expenditures? And what sectors are benefiting the most out of these concessions and under what policy objective? No reported answers are available because there is no evaluation criteria set by the government for measuring the outcomes. As a counterfactual if these concessions are reversed back and potential revenue is collected, it can:
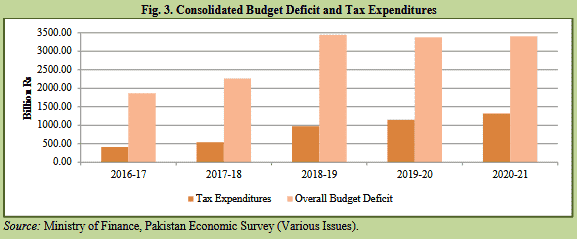
- Decrease the federal fiscal deficit, thus relieve the government from borrowing resulting in perpetual and unsustainable debt financing cost. Is the economic cost of higher deficit matched with benefits of TE?
- Increase Public Investment substantially, which otherwise is not adequately financed and thus leads to mounting pressures in Annual Development Plan (ADP) management. For FY2021-22 federal through forward[4] in (Public Sector Development Program) PSDP has increased to 6.5 trillion (Khalid and Haq, 2021). Does the growth multiplier achievable from PSDP investment is the same while allowing for these TE?
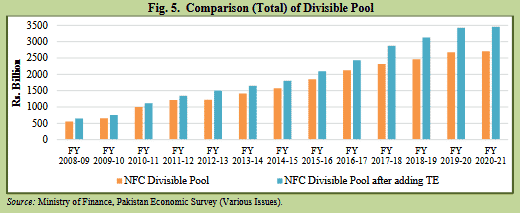
- The NFC award allocates resources between federal and provincial governments through divisible tax pool. These three taxes from which TE are carried out, constitute the federal divisible pool from which the resources are transferred to the provinces. Under the 7th NFC award provinces get a share of 57.5% of the divisible pool. Federal government is forgoing provinces rightful tax revenue share due to these tax expenditures to a specific class of individual(s) and firm(s). These exemptions and tax credits are provided by federal government without the consultation of the provinces. By increasing the share of provinces in divisible pool through scrapping TE, many objectives such as adequate financing of development projects, improving the infrastructure, employment generation, skills development of youth, health and education sector etc. can be achieved by resulting increased provincial spending. Does the current TE framework evaluate its outcome on the basis of lost opportunity on this front?
 ____________________
[4] Existing Government Projects financing need for coming years.
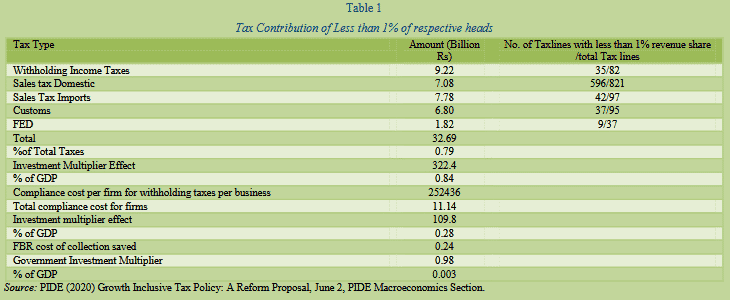
- Finally TE directly impacts FBR revenue performance. This puts pressure on FBR to go for those arbitrary and growth unfriendly policy options which are inefficient and creates a drag on GDP growth (See PIDE, 2020 & 2021). PIDE(2020) estimated the economic Deadweight loss creation by revenue non-spinners for FBR taxes. The table 1 provides the details of that. It can be seen from this table that by abolishing taxes (with less than 1% contribution in each respective tax) worth just 32.69 Billion rupees can lead to an increase of GDP conservatively by 109.8 billion rupees. This shows that how much economic burden the pursuit of revenues has created. Can we say that while approving for incremental TE this economic cost of bad tax policy-i.e. putting pressure on FBR to opt for growth unfriendly taxes considered?
CONCLUSION
Pakistan’s overall revenue collection had been low as compared to the expenditure outlays, despite healthy revenue collection by FBR. Besides these higher expenditures, for achieving certain policy goals government also opts for tax expenditures. Pakistan is not unique in this case, however tax expenditures both in absolute form and as a percentage of total tax collection have been increasing over the years. On the other hand ex-ante cost benefit analysis and post provision evaluation, which are prerequisite for fiscal governance is missing. Unproductive expenditures through exemptions and concessions must end and strict compliance, monitoring and evaluation of these expenditures should be done. Even if not all but certain portion of the TE should be reduced or kept in a specific range in relation to total taxes collected along with strict performance monitoring in terms of goal achievement should be adopted. With such reduction in tax expenditures fiscal deficit can be reduced, development spending can increase, Provinces can be supplied with more resources and finally FBR can be provide a space for better taxation. This would have an overall economic growth impact which certainly through TE to date has not been achieved.
REFERENCES
Ahmed, M. Ahmed (2019). Pakistan: Economy under Elites—Tax amnesty schemes, 2018. Asian Journal of Law and Economics, 10(2), 20190016. https://doi.org/10.1515/ajle-2019-0016
Ahmed, Ather Maqsood & Ather, Robina (2014). Study on tax expenditures in Pakistan. Washington, DC: The World Bank.
FBR, FBR Year Books (Various Issues).
Khalid, Mahmood & Haq, Ahsan ul (2021). Reforming the federal public sector development programme. (Unpublished research report).
Ministry of Finance (Various Issues). Pakistan economic survey.
PIDE (2020). Growth inclusive tax policy: A reform proposal, June 2, 2020, PIDE Macroeconomics Section.
PIDE (2021). The PIDE reform for accelerated and sustainable growth, April 22, 2021.


