
Pakistan’s domestic fertilizer industry comprises 10 major manufacturing units with a combined urea capacity of 7.3 million metric tonnes (MMT) per annum. Key producers include Fauji Fertilizers Company (FFC), Engro Fertilizer, Fatima Fertilizer, Agritech, and Fauji Fertilizer Bin Qasim (FFBL). During FY2022–23, Pakistan’s total natural gas consumption was 3,258 MMCFD (including 631 MMCFD of RLNG), of which 687 MMCFD was consumed by the fertilizer sector, representing 21% of the country’s total natural gas consumption. During July–March FY2024–25, total natural gas consumption was 3,143 MMCFD (including 798 MMCFD of RLNG), of which 764 MMCFD was utilized by the fertilizer sector, accounting for 24.3% of total natural gas consumption. During the corresponding period of FY2025–26, total natural gas consumption declined to 2,929 MMCFD (including 613 MMCFD of RLNG), while gas consumption by the fertilizer sector remained unchanged at 764 MMCFD, increasing its share to 26.1% of the country’s total natural gas consumption (GOP, 2026). Two major networks feed this sector’s gas requirement: Mari Gas and SNGPL/SSGCL.
Pakistan’s debate on competitiveness always revolves around exchange rates, tariffs, and logistics, but an important variable in this debate has always remained upstream: how much a plant is paying for its inputs. In Pakistan’s fertilizer industry, feedstock gas is not merely an input cost; it shapes the whole industry’s dynamics. Two urea producers produce an identical and price-controlled product at the same retail rate, while their feedstock gas bill differs by more than RKR 1000 per bag. The reason is which of the two gas networks their plants happen to be connected to.
This article traces that gap through three data points: the price divergence between the two networks since 2023, the redistribution of feedstock subsidies that followed, and what the combination means for the reform’s central promise, a fiscal cut that, on closer inspection, widened the competitive distortion it was meant to fix.
The Price Story: A Structural Break, Not a Cycle
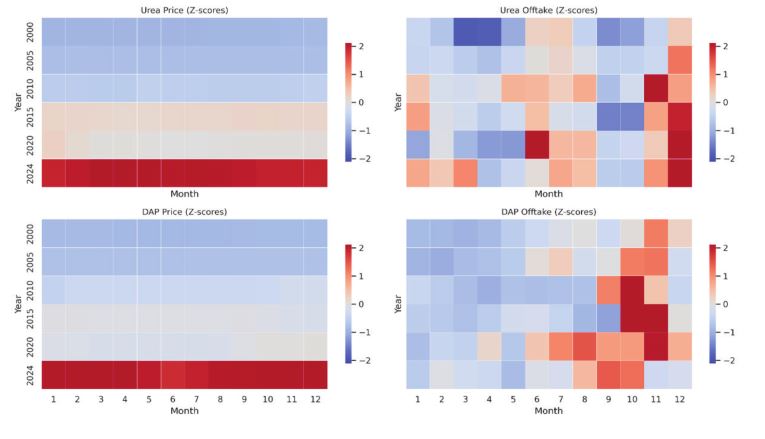
The heat maps below are the Z-Scores of monthly Urea and DAP prices and offtake from the year 2000 to 2024. They reveal how far each month’s value sits from its long-run average, shaded from deep red (well above average) to deep blue (well below average). The figures make two features stand out: the price cycle has a clean structural break rather than a cycle. Before 2018, most of the panels sit consistently in the blue range, while after 2018 that pattern flips decisively: every month every year through 2024 is in the deepest red panel on the scale. This is not a single bad year or a seasonal spike. It is a sustained climb to the top of a quarter-century distribution and tracks exactly the period when feedstock prices of SNGPL/SSGCL rose 213 percent while Mari Gas prices rose to a comparatively modest level of 92 percent.
Second, the offtake panels in the figure reveal a different story: the DAP shows that Z-Scores are scattered, reflecting seasonality with respect to Rabi and Kharif application windows rather than a demand response to price. A non-directional structural break in price, along with a seasonal, non-trending pattern in offtake, manifests a market condition where rising feedstock cost is being absorbed and passed through rather than competed away because the pattern indicates that fertilizer demand is largely inelastic and the retail price is broadly managed across firms regardless of their input cost base.
Figure 1: Z-score heatmaps of urea and DAP prices and offtake by month and year, 2000–2024.
Source: Author’s construction, based on NFDC price and offtake series.
In other words, the price escalation visible in Figure 1 is not evidence of a sector under productive strain. It is evidence of an energy cost base that has been rising steadily, and rising very differently depending on which network a plant is connected.
Two Networks, One Industry, Two Cost Structures
That divergence is where the competitiveness story actually lives. As of January 2025, Mari Gas-based plants (FFC, Fatima Fertilizer, and EFERT’s Mari-linked operations) paid PKR 580 per MMBTU for feedstock gas. SNGPL/SSGCL-based plants (Agritech, FFBL, Hazara Phosphate, and the SNGPL-linked portions of Fatima and EFERT) paid PKR 1,597 per MMBTU, a gap of PKR 1,017 per MMBTU, or roughly 64 percent lower input cost for Mari Gas-linked producers. Applying the standard assumption of about 0.8 MMBTU of feedstock gas per 50kg bag of urea, that gap alone is worth roughly PKR 814–815 per bag, before any subsidy is factored in.
The motivation behind the 2023- 25 subsidy was supposed to narrow the distortions, and on paper it did, but in reality, the analysis reveals that the implicit feedstock gas subsidy bill fell from PKR 121.2 billion in 2023-24 to PKR 84.49 billion in 2024-25, reflecting a 30.3 percent reduction that reads a genuine fiscal consolidation. However, the analysis of the composition of that reduction tells a different tale. The entire PKR 36.70 billion cut came from eliminating the support ot SSGCL/SNGPL lined fertilizer plants. Mari Gas-linked plants were granted subsidy in full and saw it rise slightly. FFCs’ support increased 7.3 percent to PKR 60.25 billion, while Fatima Fertilizer’s subsidy rose to 2.2 percent, PKR 24.24 billion.
Table 1: The feedstock price and subsidy gap between Pakistan’s two gas networks, 2023–25.
| Metric | Mari Gas Network | SNGPL/SSGCL Network |
| Feedstock price, Jan 2025 (Rs/MMBTU) | 580 | 1,597 |
| Feedstock price, Jan 2023 (Rs/MMBTU) | 302 | 510 |
| Two-year price increase | +92% | +213% |
| Implicit subsidy retained, 2024–25 | Rs 84.49 bn (full amount) | Rs 0 |
| Subsidy per 50kg bag, 2024–25 | Rs 1,009–1,213 | Rs 0 |
Source: Author’s calculations, based on NFDC Fertilizer Review 2024–25 data.
By 2024- 25, the entire remaining subsidy pool of 84.49 billion flowed to exactly two companies, and both are based on the Mari Gas network. When combined with the underlying price gap the total advantage in cost enjoyed by the Mari Gas-linked producer now exceeds PKR 1000 per bag, roughly equivalent ot a quarter of urea’s retail price. Two firms selling identical products operate on fundamentally different cost structures.
Why This Is a Competitiveness Problem, Not Just a Subsidy Problem
Apparently, it seems like a purely fiscal energy policy story or an industrial competitiveness story. Competitiveness is a firm’s ability to control costs through sourcing, scale, technology, or productivity, but in this case it’s the pipeline geography, along with an administered price schedule that treats the two networks asymmetrically.
It can have two implications for the fertilizer sector’s competitiveness and energy cost reforms in a broader sense. First, the investment signals get distorted as new investment or expansion decisions will be shaped less by market powers but more by which gas network the site can be connected to, which is not an appropriate basis for industrial capital allocation. Second, it concentrates risk: SNGPL/SSGCL already have structurally higher input costs, and any further increase in gas prices, whether at the local or international level, will expose them to shocks. As they will have little room to absorb this shock, ultimately, the effect will be transferred to the farmers through increased farm gate price or the production capacity will not be fully utilized. For a genuine reform agenda, it shows that a subsidy bill can shrink on paper while the underlying distortion it was meant to correct actually worsens, because a partial, source-based cut simply reallocates who bears the cost, rather than levelling the playing field.
The lesson can be generalized to other sectors where firms in the same sector operate under different price regimes and different energy contracts. In this way, one important aspect of achieving competitiveness becomes input infrastructure access rather than underlying internal firm efficiency.
This leads to say that the remedy should be redirected to the end users rather than producers; providing subsidies directly to the farmers instead of discounting feedstock for specific plants can result in win win situation for both the producers and consumers.
Key Takeaways
Urea and DAP price z-scores show a clean structural break from 2018 onward — not a cycle — while offtake remains seasonal and non-trending, indicating rising feedstock costs are being absorbed rather than competed away.
Mari Gas-linked plants pay Rs 580/MMBTU versus Rs 1,597/MMBTU for SNGPL/SSGCL-linked plants (Jan 2025) — a 64% cost gap worth roughly Rs 814–815 per 50kg urea bag before subsidies.
The 2023–25 subsidy reform cut total spending by 30.3%, but the entire cut came from zeroing out SNGPL/SSGCL-linked firms; Mari Gas-linked firms retained their full subsidy and saw it rise.
By 2024–25, the full Rs 84.49 billion remaining subsidy flowed to just two producers — FFC and Fatima Fertilizer — pushing the total per-bag cost advantage for Mari Gas-linked plants past Rs 1,000, roughly 20–25% of the retail price.
The result is a competitiveness gap driven by pipeline geography, not efficiency — a structural risk that recurs wherever Pakistani industry is split across unequal energy pricing regimes.
A durable fix shifts support from plant-level, network-based subsidies toward targeted end-user assistance, removing energy infrastructure history as a determinant of industrial competitiveness.
Data source: NFDC Fertilizer Review 2024–25. Per-bag and per-tonne figures are the author’s calculations, derived from NFDC’s company-wise subsidy, price, and production tables from Fertilizer Review
Dr. Sobia Rose is a Researcher at Notational Fertilizer Development Center, MoNFS&