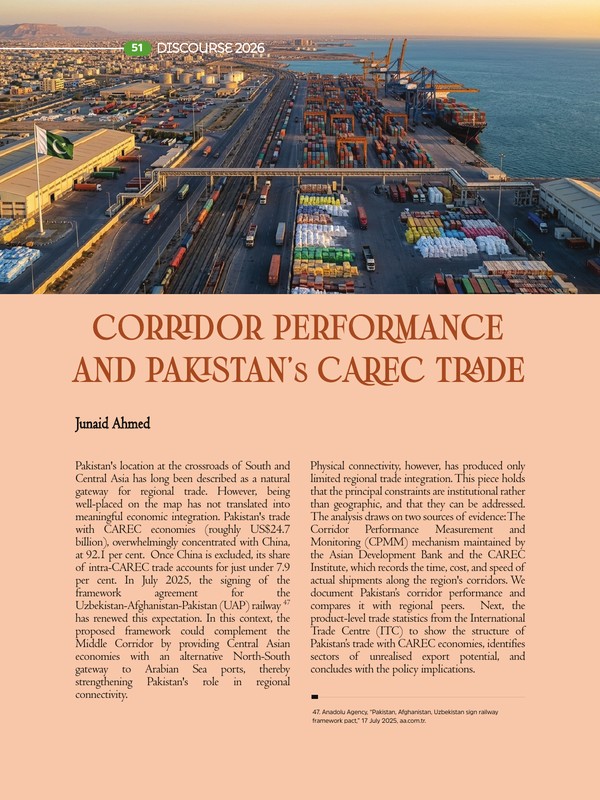
Pakistan’s location at the crossroads of South and Central Asia has long been described as a natural gateway for regional trade. However, being well-placed on the map has not translated into meaningful economic integration. Pakistan’s trade with CAREC economies (roughly US$24.7 billion), overwhelmingly concentrated with China, at 92.1 per cent. Once China is excluded, its share of intra-CAREC trade accounts for just under 7.9 per cent. In July 2025, the signing of the framework agreement for the Uzbekistan-Afghanistan-Pakistan (UAP) railway[1] has renewed this expectation. In this context, the proposed framework could complement the Middle Corridor by providing Central Asian economies with an alternative North-South gateway to Arabian Sea ports, thereby strengthening Pakistan’s role in regional connectivity.
Physical connectivity, however, has produced only limited regional trade integration. This piece holds that the principal constraints are institutional rather than geographic, and that they can be addressed. The analysis draws on two sources of evidence: The Corridor Performance Measurement and Monitoring (CPMM) mechanism maintained by the Asian Development Bank and the CAREC Institute, which records the time, cost, and speed of actual shipments along the region’s corridors. We document Pakistan’s corridor performance and compares it with regional peers. Next, the product-level trade statistics from the International Trade Centre (ITC) to show the structure of Pakistan’s trade with CAREC economies, identifies sectors of unrealised export potential, and concludes with the policy implications.
Measuring corridor performance
Assessments of connectivity often rely on infrastructure inventories, which record what has been constructed rather than how well it functions. The CPMM mechanism provides a functional alternative. In operation since 2009, it records four trade-facilitation indicators from commercial shipments along the six CAREC corridors: the time and cost required to clear a border-crossing point, the cost of transporting a consignment along a corridor section, and the speed of travel.[2] It is compiled from more than two thousand observations each year, and therefore reflects operational reality rather than perception.
For Pakistan, the 2024 results indicate deterioration rather than improvement. The average time to clear a border-crossing point rose further to 38.1 hours, an increase of 15 per cent over the previous year and the highest recorded for any CAREC member. The cost of border clearance rose to about US$259, and the cost of moving a standard consignment along a corridor section edged higher. Average corridor speed, measured with delays included, declined to 10.4 kilometres per hour, from 11.4 in 2023.[3] The longest delays occur at the Torkham and Chaman crossings with Afghanistan, where border charges rose most sharply on outbound movements.[4] Because approximately 95 per cent of Pakistan’s freight moves by road, these frictions apply to nearly the entire volume of overland trade.
Figure 1. Time to clear a border crossing (TFI1), outbound and inbound, 2024 (hours)
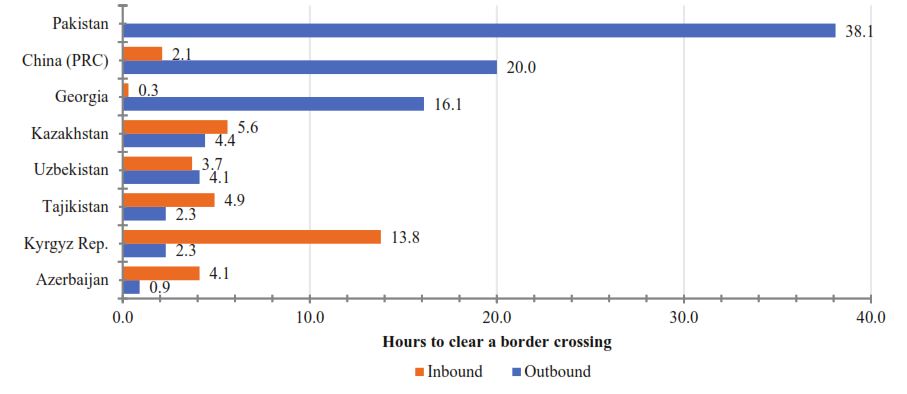
Source: CAREC CPMM Annual Report 2024. Outbound unavailable for Mongolia and Turkmenistan.
Figure 2. Cost to clear a border crossing (TFI2), outbound and inbound, 2024 (US$ per consignment)
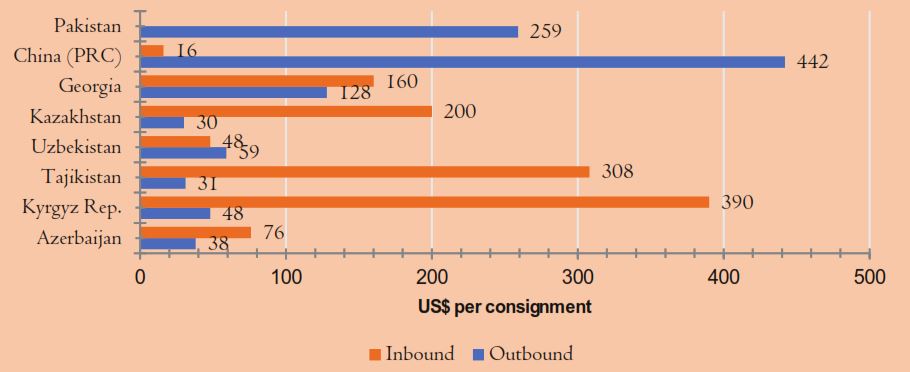
Source: CAREC CPMM Annual Report 2024. Outbound unavailable for Mongolia and Turkmenistan.
The significance of these figures is clearer in comparison. Pakistan’s CAREC neighbours operate under comparable geographic conditions, including mountainous terrain, long distances and landlocked markets, yet their border performance is markedly better. In 2024 outbound clearance still took under five hours in Azerbaijan, the Kyrgyz Republic, Tajikistan, Uzbekistan and Kazakhstan, against 38.1 hours in Pakistan (Figure 1). The cost of clearance follows a similar pattern: Pakistan’s outbound border cost, about US$259 per consignment, was several times the US$30 to US$59 recorded in the Central Asian republics, although below the level reported by the People’s Republic of China (Figure 2).[5]
In most CAREC economies inbound clearance is slower or costlier than outbound: inbound border costs reach US$390 in the Kyrgyz Republic and US$308 in Tajikistan, for example. In 2024 Georgia’s outbound clearance time fell significantly as the congestion from the 2023 rerouting of Middle Corridor traffic eased, while border charges increased in the Kyrgyz Republic, Tajikistan, and Kazakhstan. Pakistan did not separately report inbound figures for 2023; when last measured, in 2021, its inbound clearance averaged 120 hours and US$525 per consignment. These differences are difficult to attribute to geography or income alone. In 2024 Azerbaijan and Georgia reduced their outbound clearance times to under one hour and about sixteen hours, respectively. Likewise, Uzbekistan kept clearance among the fastest in the region through customs digitisation, fee rationalisation, and improved coordination among border agencies. These gains were achieved through administrative and institutional reforms rather than new infrastructure. On the other hand, Pakistan recorded higher border-clearance times and costs, along with slower corridor speeds, indicating limited progress in addressing procedural and inter-agency coordination constraints.
The structure of Pakistan’s trade with the CAREC region
Corridor inefficiency is reflected in the volume and composition of trade. In 2025 Pakistan’s bilateral merchandise trade with the ten other CAREC members constitute about approximately US$24.7 billion, of which imports accounted for US$20.9 billion and exports for US$3.7 billion, producing a regional trade deficit of about US$17 billion.[6] China accounts for approximately 92 per cent of the regional total. That concentration is primarily a feature of imports: Pakistan imported roughly US$20 billion in machinery, electronics, iron and steel, and chemicals from China, and exported approximately US$2.3 billion in return, predominantly raw copper and cotton (Table 1).
Table 1. Pakistan’s trade with CAREC members, 2025 (US$ million)
| Partner | Exports | Imports | Balance | Export growth 2021 to 2025 (%/yr) |
| China | 2,283.5 | 20,434.2 | −18,150.7 | −6.9% |
| Afghanistan | 1,104.8 | 458.4 | +646.4 | +7.2% |
| Kazakhstan | 196.1 | 1.0 | +195.1 | +0.3% |
| Uzbekistan | 106.0 | 32.2 | +73.8 | +21.3% |
| Tajikistan | 14.3 | 4.4 | +9.9 | +54.8% |
| Other Central Asia and Caucasus* | 21.6 | 11.3 | +10.2 | 3.3% |
| Total CAREC | 3,726.3 | 20,941.5 | −17,215.2 | −2.6% |
*Azerbaijan, Georgia, Kyrgyz Republic, Turkmenistan and Mongolia. Growth is compound annual, 2021 to 2025. Source: Author’s calculations from ITC Trade Map.
On the hand, the export side is more diversified but limited. China absorbs 61.3 per cent of Pakistan’s exports to CAREC and Afghanistan 29.6 per cent, leaving the five Central Asian republics a combined share of around 8.6 per cent. The composition is concentrated in primary and low-processed commodities. The four largest export categories are copper, cotton, rice and ores, and copper alone, almost all of it destined for China, constitutes approximately one-fifth of regional exports. Manufactured goods, which account for the majority of industrial employment, are largely absent. One favourable trend is evident in the geographic distribution of growth: exports to China contracted by an average of 6.9 per cent per year between 2021 and 2025, whereas exports to Uzbekistan grew by 21.3 per cent per year, and those to Tajikistan and the Kyrgyz Republic at higher rates from smaller bases.
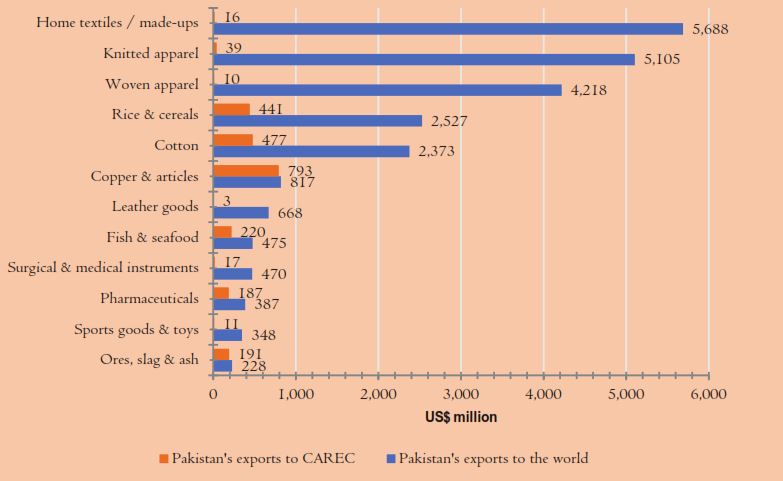
The difference between Pakistan’s global export capacity and its regional trade indicates untapped potential. Pakistan is an established exporter of several labour-intensive product groups that CAREC economies import in large quantities from other suppliers.
Figure 3. Pakistan’s exports to the world compared with exports to CAREC, selected products, 2025 (US$ million)
Source: Author’s calculations from ITC Trade Map, 2025 (HS 2-digit).
In 2025 Pakistan exported US$5.1 billion of knitted apparel, US$4.2 billion of woven apparel and US$5.7 billion of home textiles to the world, however directed less than 1 per cent of each to CAREC markets (Figure 3). The same pattern is evident in leather goods, footwear, sporting goods and surgical instruments, all of which are established Pakistani exports.
What Pakistan actually sells the region is different: its regional exports are concentrated in a few primary and low-processed commodities, led by copper, whose exports go almost entirely to CAREC, together with rice, cotton, fish and ores.
Table 2 quantifies this opportunity by comparing Pakistan’s competitive export lines with CAREC economies’ imports of the same products from the rest of the world. In apparel, home textiles, leather, and footwear, the region imports several billion dollars annually while sourcing well under 1 per cent from Pakistan. In surgical instruments and pharmaceuticals, the market potential is even larger. These are established export products rather than new export opportunities. Pakistan already exports them competitively, although their presence in regional markets remains limited. Reorienting a larger share of these exports toward the emerging Central Asian economies would contribute more to Pakistan’s export diversification and growth objectives than increasing commodity exports to a single destination.
Table 2. High-potential export sectors for CAREC markets, 2025 (US$ million)
| Sector (HS code) | CAREC imports from world | Pakistan to world | Pakistan to CAREC | Pakistan share of CAREC market |
| Surgical and medical instruments (90) | 80,763 | 470 | 17 | 0.02% |
| Pharmaceuticals (30) | 46,947 | 386 | 187 | 0.40% |
| Woven apparel (62) | 7,271 | 4,218 | 10 | 0.14% |
| Footwear (64) | 6,797 | 179 | 2 | 0.03% |
| Leather goods (42) | 6,150 | 668 | 3 | 0.05% |
| Knitted apparel (61) | 5,644 | 5,105 | 39 | 0.69% |
| Sports goods and toys (95) | 3,878 | 348 | 11 | 0.28% |
| Home textiles and made-ups (63) | 2,003 | 5,688 | 16 | 0.80% |
Note: HS 2-digit product groups. “Pakistan share of CAREC market” denotes Pakistan’s exports to CAREC as a share of CAREC economies’ imports of that product from the world. Source: Author’s calculations from ITC Trade Map, 2025.
The magnitude of the gap becomes even clearer when comparing Pakistan’s exports with India’s exports to the CAREC region. Despite similar constraints of distance and border access, and without Pakistan’s overland route, India exported roughly US$20 billion to CAREC economies in 2025, more than five times Pakistan’s US$3.7 billion.
Figure 4. Exports to CAREC by product category, Pakistan and India, 2025 (US$ million)
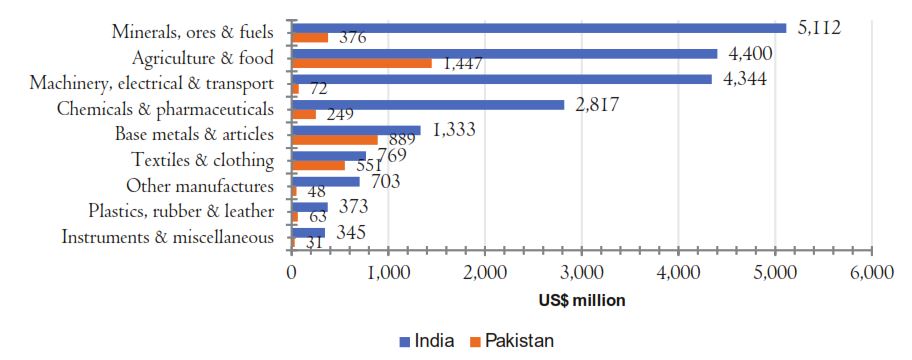
Note: Agriculture & food (01–24); Minerals, ores & fuels (25–27); Chemicals & pharmaceuticals (28–38); Plastics, rubber & leather (39–43); Textiles & clothing (50–63); Base metals & articles (72–83); Machinery, electrical & transport (84–89); Instruments & miscellaneous (90–99); Other manufactures (44–49 and 64–71: wood, paper, footwear, stone, glass and gems; for India mainly articles of human hair, HS 67). Source: Author’s calculations from ITC Trade Map, 2025.
India exported more than Pakistan in every broad product group. Its machinery, electrical and transport exports alone, at about US$4.3 billion, surpassed Pakistan’s entire regional export basket. Similarly, India outperformed in minerals and fuels (US$5.1 billion), agriculture and food (US$4.4 billion) and chemicals and pharmaceuticals (US$2.8 billion). However, the two are closest in textiles and clothing (See Figure 4). These difference reflects productive capacity and trade facilitation rather than geographic access.
These conditions are mutually reinforcing. Intra-CAREC trade excluding China represents approximately 7 per cent of the bloc’s total, compared with about 24 per cent for ASEAN,[7] a difference attributable in part to overlapping export structures and to the border frictions documented above. A trade profile in which the majority of regional trade depends on a single partner, and in which overland access to remaining markets passes through one transit economy, also carries a concentration risk.
The imbalance between infrastructure and facilitation
The regional pattern of investment helps to explain these outcomes. Since 2001 the CAREC programme has mobilised more than US$53.8 billion across its eleven member states. Approximately 69.5% of this total was allocated to transport, followed by energy 22.8% and about 2.2 % to trade facilitation.[8] The region, including Pakistan, has therefore invested heavily in physical infrastructure and comparatively little in the administrative systems that determine its use, namely customs modernisation, standards harmonisation, digital documentation and the institutions required to operate them.
Pakistan’s principal constraints are predominantly administrative. They include duplicative customs procedures; non-tariff barriers, in particular the sanitary and phytosanitary requirements that restrict access for food and agricultural exports; reliance on informal transit arrangements through Afghanistan; limited trade financing and correspondent-banking links with Central Asia; and, with respect to the movement of persons, restrictive visa regimes and an absence of direct air links. None of these constraints is addressed by additional road or rail capacity. Together they will determine whether the UAP railway, once completed, operates near its stated capacity of 20 million tonnes per year.
Conclusion and Policy implications
Pakistan’s national export strategy, URAAN Pakistan, sets a target of US$60 billion in exports.[9] This objective is not attainable under prevailing corridor performance and an export structure dominated by textiles and raw materials. The constraints identified in this analysis, however, are administrative and institutional rather than geographic, and are therefore amenable to policy reform within existing resources.
In the emerging regional configuration, economic integration depends on institutional capability as well as on physical infrastructure. Pakistan has established its physical position within regional networks. Whether that position translates into trade integration will depend on the parallel development of the administrative and regulatory systems required to make the infrastructure productive.
Since the constraints are primarily administrative, the appropriate policy responses are administrative and can largely be implemented without major new infrastructure.
Performance measurement. Pakistan should treat border and corridor performance as key economic performance indicators and adopt CPMM-style metrics as national performance benchmarks, with clear institutional accountability for achieving them.
Trade facilitation. The Pakistan Single Window is operational and should be extended through interoperability with neighbouring customs administrations, risk-based inspection, mutual recognition of Authorised Economic Operators, and expanded use of the TIR transit regime.
Export diversification. Pakistan’s most promising opportunities lie in the labour-intensive products in which it is already internationally competitive, including apparel, home textiles, leather goods, footwear, surgical instruments and sporting goods processed foods, particularly halal products, and pharmaceuticals. Special Economic Zones and the Special Investment Facilitation Council should be prioritise investment and export promotion in these sectors rather than toward import substitution.
Mobility and payments. Liberalised business visa arrangements, direct air connections to Tashkent, Almaty, and Baku, and reliable banking channels are comparatively low-cost measures that lead towards trade promotion.
Infrastructure sequencing. The projected benefits of the UAP railway, including a reduction in Uzbekistan to Pakistan transit time from about 35 days to under one week and a cost reduction exceeding 40 per cent, will be realised only if border procedures, product standards and payment systems are operational when the infrastructure is completed.[10]
Junaid Ahmed is Chief of Research at the Pakistan Institute of Development Economics (PIDE), Islamabad
[1]Anadolu Agency, “Pakistan, Afghanistan, Uzbekistan sign railway framework pact,” 17 July 2025, aa.com.tr.
[2]CAREC Corridor Performance Measurement and Monitoring (CPMM) Annual Report 2024, Asian Development Bank and CAREC Institute; data portal at cpmm.carecprogram.org/data. The mechanism records around 2,000 shipment samples annually on the six CAREC corridors.
[3]CPMM Annual Report 2024, Table 6.7 (Trade Facilitation Indicators for Pakistan, road transport, 2022 to 2024).
[4]CPMM Annual Report 2024, Pakistan country update (Table 6.7; Torkham and Chaman border-crossing points).
[5]CPMM Annual Report 2024, country tables: Azerbaijan (6.1), People’s Republic of China (6.2), Georgia (6.3), Kazakhstan (6.4), Kyrgyz Republic (6.5), Pakistan (6.7), Tajikistan (6.8) and Uzbekistan (6.10); CAREC road averages from the Key Results chapter.
[6]Author’s calculations from International Trade Centre, Trade Map (trademap.org): Pakistan’s exports to, imports from and trade balance with CAREC members, 2025.
[7]Asian Development Bank, Digitally Connected CAREC: Digital Trade, Emerging Regulatory Challenges, and Solutions
Shocks (2025), carecprogram.org: intra-CAREC trade excluding the People’s Republic of China was approximately 7 per cent of the bloc’s total, compared with about 24 per cent for ASEAN.
[8]CAREC Implementation Progress Report, 24th Ministerial Conference (2025), carecprogram.org.
[9]Government of Pakistan, URAAN Pakistan: National Economic Transformation Plan (Ministry of Planning, Development and Special Initiatives), export target of US$60 billion by 2029.
[10] The UAP railway (Termez to Kharlachi via Afghanistan) is projected to carry up to 20 million tonnes per year at an estimated cost of US$4.8–7 billion, cutting Uzbekistan–Pakistan freight transit time by up to five days and transport costs by about 40 per cent. The Uzbekistan–Afghanistan–Pakistan (UAP) Railway: A Bridge to Geoeconomics,2025, Issue Brief, Institute of Strategic Studies Islamabad..