In Pakistan, the misuse of discretionary powers in the allocation of development funds has long been a source of inefficiency and political favoritism. Back in 2018, the then Prime Minister of Pakistan, upon forming the 22nd cabinet, pledged to curb this practice by ending the discretionary use of public funds[1], a move announced during his first cabinet meeting. Subsequently, the government of Khyber Pakhtunkhwa introduced an Annual Development Program (ADP) policy prior to the 2020-21 budget that abolished the Chief Minister’s discretionary authority over the allocation of funds in the long-term ADP, signaling a shift towards more rules-based and transparent development planning[2].
The broader debate between rules and discretion, often framed as commitment versus flexibility in fiscal operations, has largely been resolved in favor of the rational, rule-based approaches. Economists widely agree that political governments tend to be present-biased, often prioritizing short-term gains over long-term efficiency[3]. While some degree of discretion over non-developmental spending may be justified, particularly in times of crises, development spending should not be subject to the same flexibility. The allocation of development budgets must be guided by principles of efficiency and, where appropriate, equity, rather than political convenience.
Sound economic policy demands that public sector commitments be matched by corresponding actions. Renouncing discretion in the allocation of public funds, especially development funds, is a commendable step, but it must be backed by consistent implementation. Unfortunately, this is seldom the case in Pakistan.
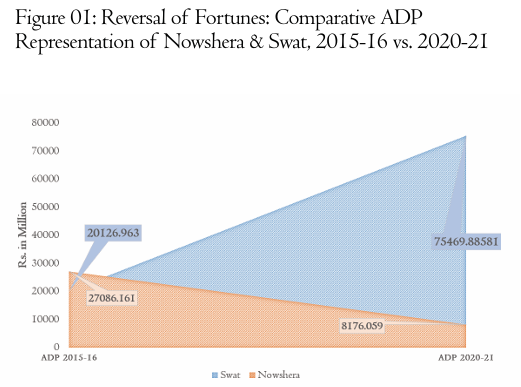
A glimpse of the gap between rhetoric and reality can be seen in Figure 01, which compares the total value of new projects listed in the ADP of 2015-16 and 2020-21 for two selected districts of Khyber Pakhtunkhwa[4]. In ADP 2015-16, the total value of new projects in Nowshera was 29 percent higher than in Swat. By 2020-21, the situation had dramatically reversed: the value of new projects in Swat increased by 116 percent, while Nowshera witnessed a decline of approximately 107 percent. Given the selection criteria applied in the analysis, both in terms of the types of projects[5] and the number of districts[6], the average share of new projects per district in the ADP 2020-21 should have been around 8.33 percent. However, Swat alone received a disproportionate large share of 52.22 percent[7].
Equity in Development Spending: A Missing Priority?
One of the most critical yet overlooked questions in development spending is whether funds are allocated in a way that reflects the varying needs of different regions. In this context, equity can be understood as, “the absence of systematic disparities in resource allocation between regions with different levels of underlying social [and economic] advantage/disadvantage”. Before assessing whether such disparities exist in the allocation of development funds, Figure 2 and 3 illustrates the underlying economic and social conditions of the selected districts in Khyber Pakhtunkhwa. The first indicator, shown in Figure 2, is relative poverty in the selected districts[8], where Dir Upper, Dir Lower, and Shangla emerge as the three most disadvantaged districts. In terms of relative educational attainment[9] (Figure 2), the most deprived districts are Shangla, Buner, and Dir Upper.
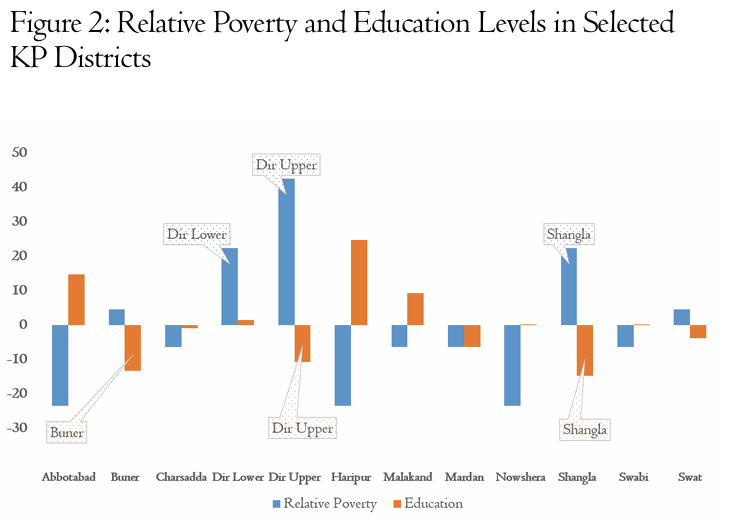
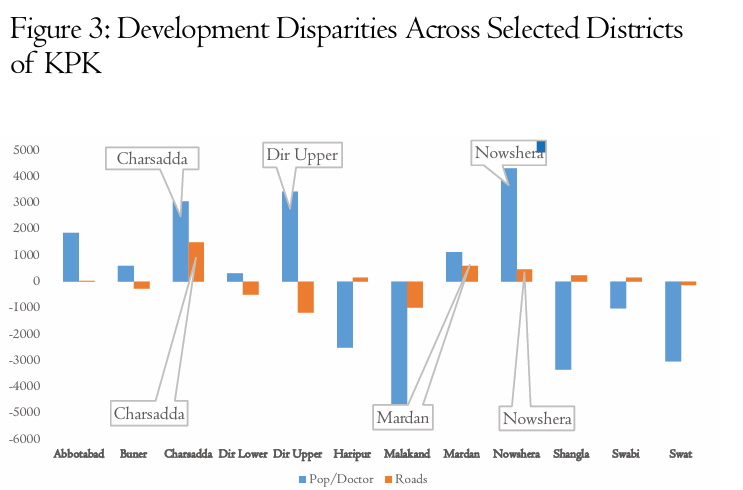
Figure 3 presents data on two indicators of relative public service provision in the selected districts of Khyber Pakhtunkhwa: population per doctor (reflecting relative health facilities) and population per kilometer of road (reflecting relative infrastructure access)[10]. Since these indicators are measured as deviations from the mean across the selected districts, higher values suggest weaker service provision. Based on this, Nowshera, Dir Upper, and Charsadda perform poorly in terms of health facilities, while Charsadda, Mardan, and Nowshera have the highest population per kilometer of road. Overall, the underlying conditions suggest that Dir Upper is the most deprived district, lagging in three dimensions, followed by Shangla, Charsadda, and Nowshera, each lagging in two dimensions. One the other hand, Malakand appears to be the most well-endowed, showing strength in three dimensions, followed by Haripur and Abbottabad.
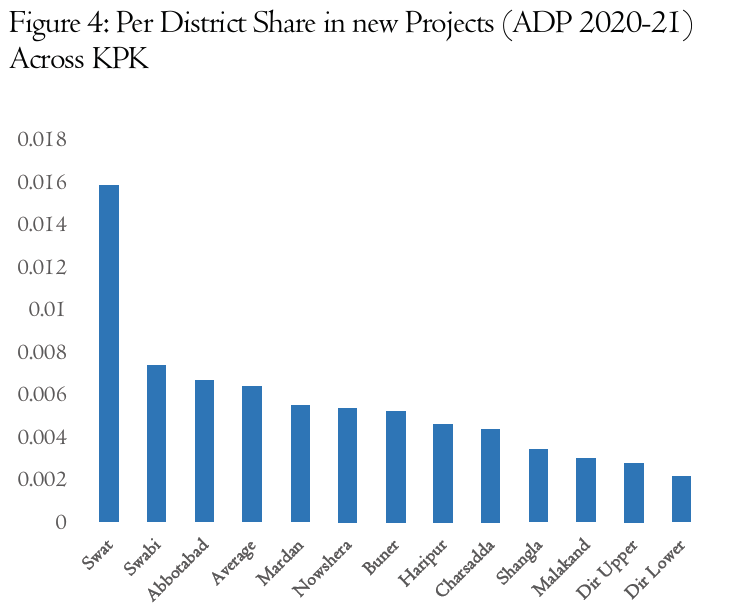
None of the most deprived districts, as identified in the analysis, are adequately represented in ADP 2020-21, a fact clearly reflected in the per district shares of the new projects across districts (Figure 4)[11]. In contrast, Abbotabad, one of the better-off districts based on the selected indicators, ranks among the top three districts with share in ADP 2020-21 significantly above the average, with Swat receiving the highest share overall. Based on the operational definition of equity used in this analysis, these patterns reveal systematic disparities in resource allocations. Therefore, it can be concluded that the ADP 2020-21, like its predecessor and successors, was not guided by equity considerations.
Efficiency in Development Spending: A Guiding Principle or an Afterthought?
Allocating huge sums under the “development budget” will yield little benefits if the planning and approval processes remain rushed and poorly structured. As previously noted, discretionary power continues to dominate both project approval and fund allocation. In Pakistan, most approved PC-I and PC-II documents for social sector projects lack the critical element of ‘economic viability’. A commonly repeated phrase in these documents is, “the financial benefits of the project cannot be quantified,” or “the project is not intended to earn profit”. Ironically, such justifications are routinely accepted, as evidenced by the approval of these projects. The absence of a proper cost-benefit analysis in approved PC-Is reflects a broader issue of unchecked discretion, a practice that must end if development funds are to generate meaningful and measurable outcomes.
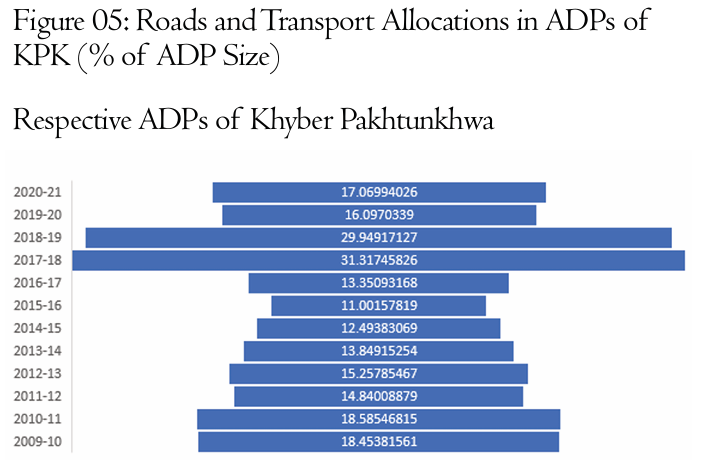
Beyond the issue of discretion, the sectoral focus of the development funds may also contribute to inefficiencies. For example, Figure 5 shows annual allocations to the roads and transport sector in Khyber Pakhtunkhwa’s ADPs overtime. Historically, around 18% of ADP allocations have been directed to this sector. In ADP 2020-21, the share of road-related projects among new projects for the districts of Abbotabad, Swabi, and Swat was disproportionately high (62%, 49%, and 40% respectively). While roads are undeniably important, an overemphasis on a single type of infrastructure, without a proper assessment of the local needs, risks inefficient use of public resources. For instance, Swat ranks relatively high in poverty, while Abbottabad performs poorly on the population-to-doctor ratio (as shown in Figure 2 and 3). In such contexts, prioritizing road construction is unlikely to address the core developmental challenges facing these districts.
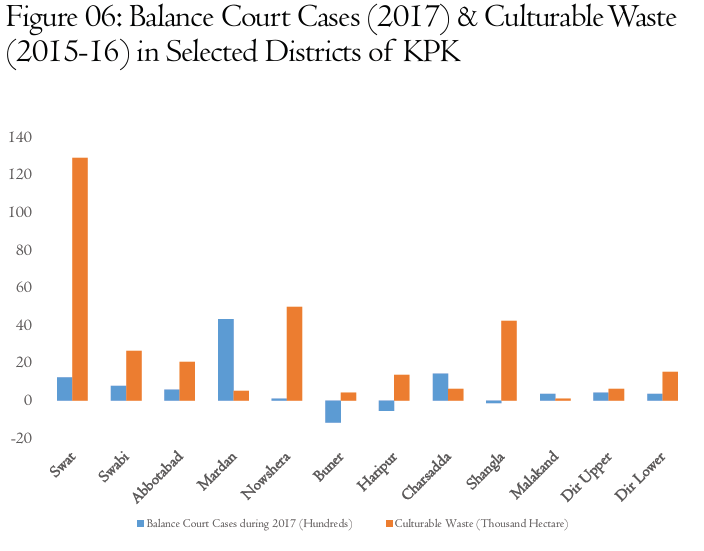
Looking from another perspective, one might suggest prioritizing projects that enhance the efficiency of the criminal justice system or reduce culturable land waste in these districts (see Figure 6)[12]. In Khyber Pakhtunkhwa, one key factor behind high levels of culturable waste is unresolved land disputes. By improving court efficiency and expediting the resolution of such cases, agricultural productivity could be significantly increased. This example highlights a broader point: a balanced focus on both the “software” of the economy (institutions) and the “hardware” (factors of production) is essential for maximizing development outcomes and expanding the national economic pie.
Final Reflections
As the name suggested, the primary goal of the development budget should be to expand the national economic pie. However, this goal cannot be achieved if resource allocation continues to rely on heuristic or discretionary decisions. Instead, project selection must be grounded on rigorous cost-benefits and gap analysis. Furthermore, it is time to shift the focus from the traditional, infrastructure-heavy model toward strengthening the institutional “software” of the economy, an approach more likely to yield sustainable and inclusive growth.
Dr. Ikram Ullah is currently serving as an Assistant Professor at the Department of Economics, University of Malakand.
[1] Shah, S M, “Non-development and Discretion,” The News International, September 05, 2018, https://www.thenews.com.pk/print/363947-non-development-and-discretion.
[2] Ali, M, “Khyber Pakhtunkhwa Slashes Current Spending by Rs, 95 billion,” Dawn, December 10, 2019, https://www.dawn.com/news/1521424.
[3] Badinger, H., and Reuter, W. H. (2017). The Case for Fiscal Rules. Economic Modeling, 60, 334-343.
[4] The selection of the two ADPs is deliberate: the 2015-16 ADP represent the second ADP of Pervez Khattak’s tenure as Chief Minister, while the 2020-21 ADP corresponds to the second year of Mahmood Khan’s tenure in the same office.
[5] Project inclusion/exclusion criteria: The analysis includes projects that meet the following conditions: (i) they have clearly specified locations (such as district, multiple districts, or an administrative division); and (ii) they were either approved during the previous financial year (from July 1, 2014/2019 to the publication date of the respective ADPs are published) or are listed as new projects pending approved by the Provincial Development Working Party (PDWP). For projects covering multiple districts or an entire division, the total cost is evenly divided among the relevant districts, and the resulting share is attributed to each district. Projects that meet the inclusion criteria but have ambiguous titles, i.e., those whose geographic scope cannot be determined from their names (e.g., construction of ABC units of XYZ in Khyber Pakhtunkhwa) are excluded from the analysis.
[6] Districts that were part of the former Federally Administered Tribal Area (FATA), as well as those associated with Frontier Regions (FRs), are excluded from the analysis.
[7] If two mega projects for Swat, worth a combined total of Rs. 38905 million and listed at serial number 574 and 575 in ADP 2020-21, are excluded, Swat’s share drops from 52 percent to 35 percent. Accordingly, these two projects are excluded from the remainder of the analysis.
[8] Data for calculating this indicator (relative poverty) is collected from the Pakistan Poverty Alleviation Fund (PPAF) Annual Report 2019 for the selected districts [https://www.ppaf.org.pk/annual-reports]. The average poverty headcount of these districts was calculated, and each district’s deviation from this average was computed by subtracting the mean from its individual score. Positive values indicate higher relative poverty compared to the group average, while negative values indicate lower relative poverty.
[9] Data on education scores was obtained from Alif Ailaan [https://sdpi.org/alif-ailaan-pakistan-district-education-rankings-2015/publication_detail]. Relative education scores were calculated using the same method described in footnote 4. However, positive values indicate relatively better educational attainment, while negative values indicate relatively poorer educational attainment.
[10] Data on population per doctor and population per kilometer of roads were obtained from the Development Statistics of Khyber Pakhtunkhwa (2017) [https://kpbos.gov.pk/search/publication-detail?id=6]. Relative scores were calculated using the same method as in footnotes 4 and 5. The roads data includes both high-quality and low-quality roads within each district.
[11] The data presented in Figure 4 may also serve as a standard indicator for assessing the equity of resource distribution among the districts of Khyber Pakhtunkhwa.
[12] Figure 6 presents two variables. The first one, i.e., balance court cases, is calculated by subtracting the number of pending cases in January 2017 from those in December 2017 for each selected district’s courts. The resulting values are then expressed as deviation from the group mean. Higher bars indicate comparatively poorer court performance. The second variable, i.e., culturable waste, is measured in thousands of hectares and represents land that remained uncultivated for two consecutive years despite being suitable for cultivation. Data on the two indicators is obtained from: http://ljcp.gov.pk/nljcp/home/publication, and https://kp.gov.pk/uploads/2023/10/Land_Use_Statistics_(2015-16).pdf.