Drivers of Inflation: From Roots to Regressions
Drivers of Inflation: From Roots to Regressions
Inflation has become a topic of serious discussion since the 1970s due to its well-documented cost (see Box 1), and the policy-makers always try to concentrate on inflation-averse policies. Therefore, the understanding of the drivers of inflation is essential for designing policies to control inflation. The understanding of inflation is not only an academic discussion, but the source of inflation also shapes the policy to control inflation (Khan and Schimmelpfennig, 2006). For example, if inflation is a monetary phenomenon, then it is the country’s fiscal and monetary authorities’ concern. On the other hand, if it comes from supply-side issue, the solution often lies in excessive regulation, barriers to movement of goods and a closed economy.
Friedman (1963) documents that inflation is always and everywhere a monetary phenomenon. However, other equally prominent studies identify that there are many other important drivers of inflation. These are supply-side constraints, rising cost, exchange rate, commodity prices, taxes, global shocks and administrative prices (Haque and Qayyum, 2006). Ha, et al. (2019), along with others, suggest several important inflation drivers at the macro-level (see Box 2).[1]
This brief attempts to understand the sources of inflation for better suggestions to the policy-makers and other stakeholders. Specifically, this brief will try to answer three major questions:
- What are the major drivers of inflation?
- How these drivers differ according to the countries characteristics?
- What are the major drivers of inflation in Pakistan at micro and macro level?
| Box 1: Inflation and Why does it Matter Definition and Measurement: Inflation is persistent, appreciable and general price rise. The measurement of inflation is not a straight forward task. No single measure is an appropriate representative of whole population. However, the most of the central banks and monetary authorities use the consumer price index (CPI) as their main measure of inflation. This study also uses CPI to gauge inflation. Cost of Inflation: it is well documented that high inflation is often associated with lower economic growth and financial uncertainties (Mishkin 2008). Furthermore, it is linked to weaker investor confidence, reduce the saving incentives, hurt the public sector balance sheets and hurts the poor (Haque and Qayyum, 2006). |
| Box 2: Important Drivers of Inflation Ha et al. (2019) identify seven major factors which may drive inflation at macro level. These are: · oil prices · external demand shocks · external supply shocks · internal demand · internal supply · monetary policy and · exchange rate Following Freidman (1963) there is a debate that unless accommodated by monetary expansion, real shocks will not persist and hence inflation will die out over time. |
-
THE DRIVERS OF INFLATION ACROSS THE WORLD
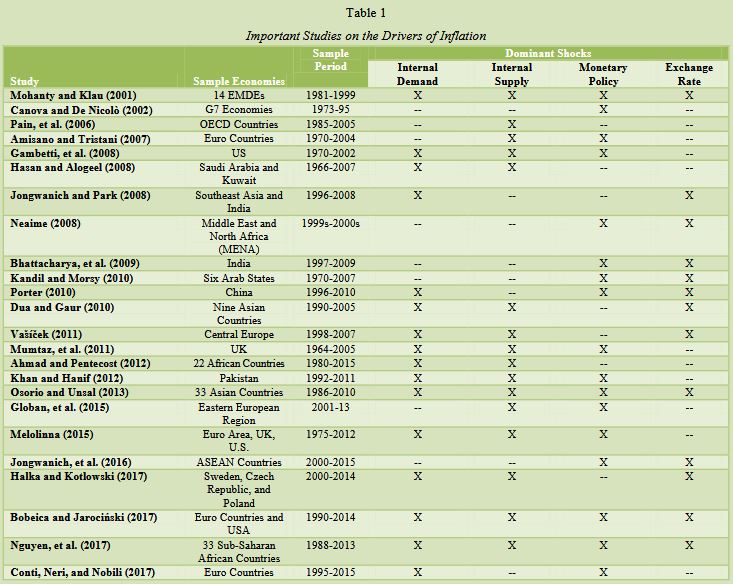
A comprehensive review of the literature is presented in Table 1, and the key takeaways from the literature are as follows:
- There are five primary drivers of inflation, along with some others. These are internal demand, internal supply, monetary policy, exchange rate and external shocks (see Box 2).
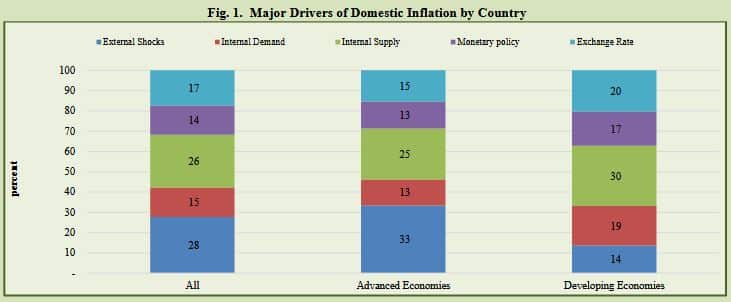
- The contribution of external shocks remains dominant in advanced economies. It explains around 33 percent of the total inflation in the advanced economies. On the other hand, in developing economies, the internal supply remains the largest contributor (around 30 percent) following exchange rate, internal demand, monetary policy and external shocks (see Figure 1).
- It is also important to note that the internal supply has a significant role in all three samples.
____________________________
[1]It is also important to mention that various studies use different names for external shocks like global shocks and international shocks. Similarly, the domestic shocks for the internal shocks. However, the present study uses the standard jargons like internal shocks and external shocks. Specifically, the study explains the variation of domestic inflation by using Factor Augmented Vector Auto Regressive (FVAR) Model and quantify the role of seven factors in driving the inflation for 29 advanced economies and 26 developing economies.
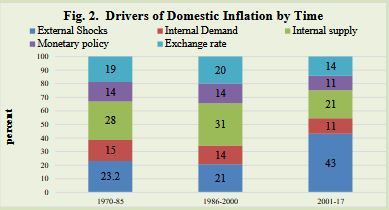
- The role of external shocks in explaining inflation has
increased over the last two decades. Its contribution
has become more than double from 20 percent to 43
percent. The role of internal supply and monetary
policy has decreased significantly, from 31 percent to
20 percent and from 15 percent to 10 percent,
respectively, over the last two decades (see Figure 2). -
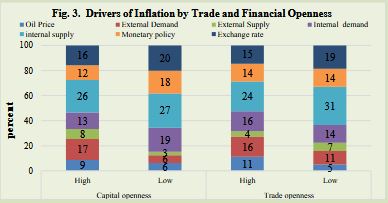
The literature considers four other important crosscountry characteristics to evaluate the role of different shock in explaining inflation variation. These are trade openness, financial openness (capital openness), exchange rate regime and monetary policy regime (see Box 3)
- Specifically, external shocks contribute 32 percent to the domestic inflation in high trade open countries, while this contribution is 22 percent in low trade open countries. Similarly, global shocks contribute around 34 percent towards domestic inflation in high capital open countries while 15 percent in low capital open countries. Furthermore, commodity importer countries have also the same tendency.
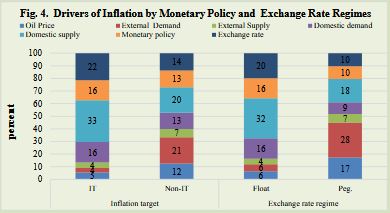
- However, the global shocks have three times less contribution in inflation, targeting regime-around 13 percent compared to the non-inflation targeting regime- around 40 percent (see Figure 4).
- Similarly, the countries with a fixed exchange rate regime are more vulnerable to global shocks as compared to the floating exchange rate regime (see Figure 4).
-
THE CASE OF PAKISTAN
The final inflation figure is a complicated thing encapsulating uncountable activities on both the economic and political front. The sources and the drivers of inflation vary from country to country. However, some essential contributors can be identified in the case of Pakistan. These are administrative prices on micro side. While money supply, government borrowing and exchange rate are the major drivers on the macro side.
2.1. Micro Determinants of the Inflation in Pakistan
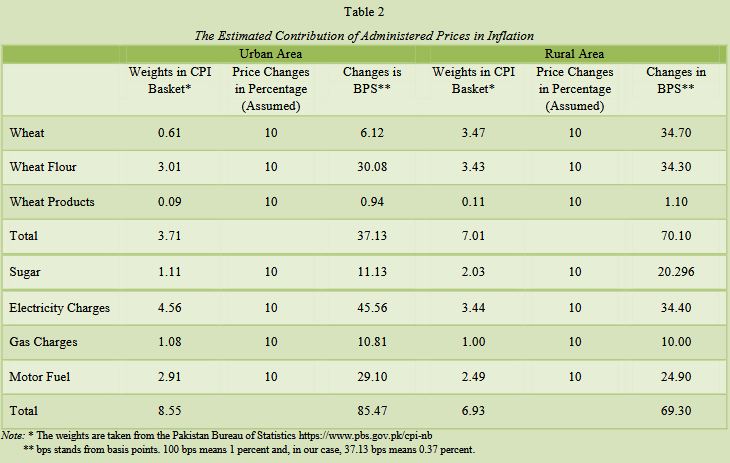
From the micro side, administrative control over the prices is the primary tool that government authorities utilise to keep the prices in control. Generally, wheat, sugar and utility prices are considered in this group. The government may control/derive inflation through these prices. This brief attempt to check the estimated contribution of administered prices in inflation of the rural and the urban areas of Pakistan (see Table 2). Three important commodities or commodity groups are taken to analyse, both for rural and urban areas, which have the administered prices. These are wheat and related products, sugar and utilities (energy group). The table shows that the weights in the CPI basket and simulated changes in general inflation of rural and urban areas by changes in the 10 percent price of the commodity. The details are given below:
| Box 3. Cross-Countries Characteristics The drivers of inflation are sensitive to several cross-countries characteristics. For example, the exchange rate may derive inflation differently in floating exchange rate regime as compared to fixed exchange rate. Therefore, the empirical studies control regression with several cross-countries characteristics. We shall discuss four important characteristics in this brief. These are trade openness, financial openness/capital openness, inflation targeting regime and exchange rate regimes. Specifically, these are defined as follows: Trade Openness: The trade to GDP ratio is taken from world development indicators and then median is calculated. The economies which are above the median are termed as ‘high’ and below the median are termed as ‘low. Capital Openness: Chinn and Ito (2017) classification is used for the capital /financial openness. The economies which are above the median are termed as ‘high’ and below the median are termed as ‘low’ capital openness. Inflation Targeting: The dummies for the inflation targeting regime are taken according to IMF (2016). Exchange Rate Regime: Ilzetzki et al (2017) classifications are used for defining the exchange rate regimes. We demarcate only two regimes. Free floating and managed floating are termed as flexible exchange rate regime and rest all others are combined as Fixed exchange rate regime. |
Utility Prices
The most prominent ones are utility prices (Gas, electricity) and petroleum products. These items carry a weight of 8.5 percent in the urban basket and 6.9 percent in the rural basket, and an approximate average of 7.7 percent in the overall basket. So, if the government increases the prices of administrated utility commodities by 10 percent, it will increase 75 basis points (bps) in the general inflation level.[2] It may be considered that this is the direct impact, and a second-round impact of an equal amount can be generated in the following months.
Wheat and Related Products
Wheat as a raw commodity carries the weights of 3.5 and 0.6 percent in Rural and Urban CPI baskets, respectively. Therefore, an increase of 10 percent in the wheat support prices increases the overall inflation by 0.35 percent and 0.06 percent in the rural and urban CPI basket, respectively. Wheat flour, suji, and vermicelli carry weights of 3.5 and 3.1 percent in Rural and Urban CPI baskets, respectively. In the case of complete pass-through of wheat prices to these products, the rural CPI would increase by 35 bps, and the urban CPI would increase by 31 bps. Finally, bakery and tandoori roti carry weights of 0.9 and 1.4 percent in Rural and Urban CPI baskets, respectively. In the case of complete pass-through of wheat prices to these products, the rural CPI would increase by 0.09 bps, and the urban CPI would increase by 0.14 bps.
Aggregating all these impacts indicate that the rural CPI would increase by 79 bps and the urban CPI would increase by 51 bps due to increase in prices of wheat and its products along with the second round impacts.
The second-round effect will be carried by the expectations and expectation momentum, causing more severe than the first-round effect. Khan and Schimmelpfennig (2006) estimate that the wheat support price’s pass-through price is 0.4 percent in Pakistan.
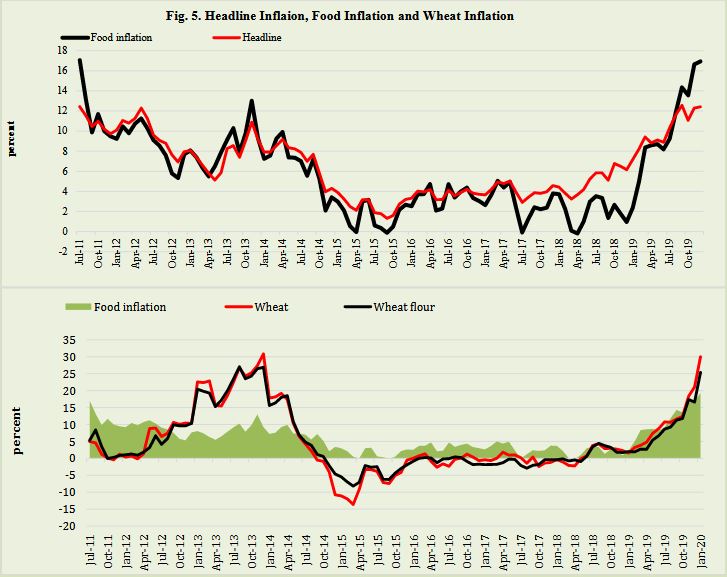
The Figure 5 shows that there is a close connection between the food inflation and the headline inflation. The lower part of the figure shows more interesting part that the wheat and wheat flour is the major contributor in the food inflation.
_______________________________________
[2] To calculate the pass through on inflation of an increase of specific price, we use simple formula weight *Change , that is, 0.075*10= 0.75.
Sugar Prices
The sugar carries weights of 2.03 and 1.11 percent in Rural and Urban CPI baskets, respectively. Therefore, pass-through will 20 bps and 10 bps in the rural and urban basket, respectively, by increasing 10 percent of the sugar prices.
2.2. Macro Determinants of Inflation in Pakistan
In addition to the direct impact through administrative measures, the general prices have deep roots attached with other macroeconomic activities like growth, money supply, exchange rate and government borrowing (see Box 4).
According to our estimates, the elasticity of inflation to broad money supply growth is around 8 percent, which means that a 10 percent rise in money supply will add around 80 basis points to the average inflation rate.
The government borrowing remained a major source of financing over the last 15 years. It is well settled in the literature that the government borrowing is inflationary. The elasticity of inflation with respect to government shows that the inflation may rise 100 bps with a 10 percent increase in the government borrowing.
Finally, the widely discussed economic variable, depreciation of exchange rate. According to estimates, 1 percent of exchange rate depreciation brings an increase of around 14-16 basis points in the general inflation level (see Jalil, 2020). The Figures 6A, 6B and 6C also confirm that government borrowing, M2 growth; exchange rate movements may explain the variation of the inflation.
| Box 4: The Estimation Strategy for Inflation Forecast The estimation of Inflation forecast is taken by using a multivariate model in a Structural Vector Autoregressive (SVAR) model. The key features of the multivariate models can be depicted by the following function form: CPI=f(oil price, exchange rate, trade, M2, Public Sector Borrowing, Private Sector Credit, and Large Scale Manufacturing Index ). The usual theoretical restrictions are applied to get the meaningful estimates. The data frequency is 1990-to date. |
CONCLUSION AND MESSAGES
The following important messages can be drawn from this knowledge brief:
- The internal supply shocks (a rise in domestic output growth) and external supply shocks (a rise in the global output growth) are the most important drivers of the inflation.
- The internal supply is also an important driver when an economy follows flexible /floating exchange rate regime, with high trade openness, high capital openness and inflation targeting policies.
- The administered prices do not have a very high proportion in the inflation of Pakistan. Its ranging from 11 bps to 80 bps.
- On macro side, the government borrowing remains the major source of inflation in the last fifteen years.
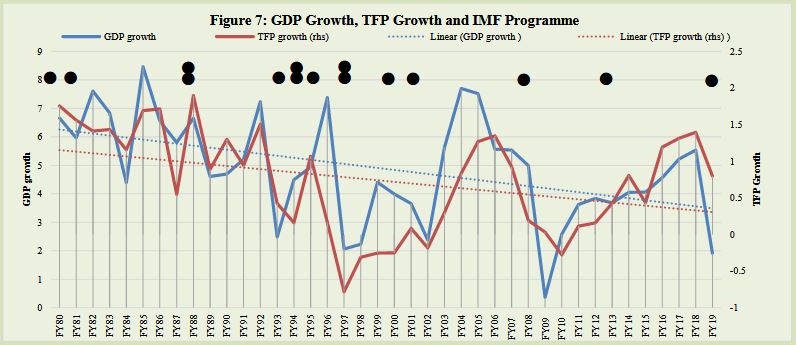
These outcomes guide us that the policy makers need to build resilience to internal supply shocks and global supply shocks. This is particularly relevant for policy makers in small, open economies like Pakistan with deep or rapidly growing integration into global trade and financial networks and supply chains. Pakistan’s output growth difficulties are longstanding and adopting stabilisation policies that reduce growth. Both economic growth and productivity are low and declining (see Figure 7; black Dots are IMF programs in the corresponding year). The economic growth is still below 4 percent. If there is any excess demand, our efforts should be geared to improving supply rather than suppressing growth at this level. If our economy cannot sustain 4 percent growth, then there are some serious issues and solution lies on the supply side. Monetary policy cannot improve food supply and cannot help produce electricity at lower cost. Therefore, the growth is the panacea.
Second important message for the policy maker is that administered prices do not have a huge a contribution in the inflation of Pakistan. But, it may cost the economy from the fiscal side- subsidies and circular debts and the market distortions.
Finally, it must be noted that this estimate is not an argument against low inflation. This estimate merely informs policy-makers of what to expect for economic growth and employment in an adjustment programme.
REFERENCES
Ahmad, A. H. & Pentecost, E. (2012). Identifying aggregate supply and demand shocks in small open economies: Empirical evidence from African countries. International Review of Economics and Finance 21(1), 272–91.
Amisano, G. & Tristani, O. (2007). Euro area inflation persistence in an estimated nonlinear DSGE model. European Central Bank, Frankfurt am Main. (ECB Working Paper 754).
Bhattacharya, R., Patnaik, I., & Shah, A. (2011) Monetary policy transmission in an emerging market setting. International Monetary Fund, Washington, DC. (IMF Working Paper 11/5).
Bobeica, E. & Jarociński, M. (2017). Missing disinflation and missing inflation: The puzzles that aren’t. European Central Bank, Frankfurt am Main. (ECB Working Paper Series 2000).
Canova, F. & De Nicolo, G. (2002). Monetary disturbances matter for business fluctuations in the G-7. Journal of Monetary Economics 49(6), 1131–59.
Conti, A. M., Neri, S., & Nobili, A. (2017). Low inflation and monetary policy in the Euro area. European Central Bank, Frankfurt am Main. (ECB Working Paper 2005).
Chinn, M. & Ito, H. (2017). The Chinn-Ito index: A De Jure measure of financial openness. http://web.pdx.edu/~ito/Chinn-Ito_website.htm.
Dua, P. & Gaur, U. (2009). Determination of inflation in an open economy Phillips curve framework—The case of developed and developing Asian countries. Centre for Development Economics, Delhi School of Economics, New Delhi, India. (Working Paper 178).
Friedman, M. (1963). Inflation: Causes and consequences. New York: Asia Publishing House.
Gambetti, L., Pappa, E. & Canova, F. (2008). The structural dynamics of U.S. output and inflation: What explains the changes? Journal of Money, Credit and Banking 40(2-3), 369–88.
Globan, T., Arčabić, V., & Sorić, P. (2015). Inflation in new EU member states: A domestically or externally driven phenomenon? Emerging Markets Finance and Trade 51(6), 1–15.
Hałka, A. & Kotłowski, J. (2017). Global or domestic? Which shocks drive inflation in European small open economies? Narodowy Bank Polski, Warsaw, Poland. (NBP Working Paper 232).
Ha, Jongrim, Kose, M. Ayhan, Ohnsorge, & Franziska, L. (2019). Understanding inflation in emerging and developing economies. World Bank, Washington, DC. (Policy Research Working Paper No. 8761).
Haque, N. U. & Qayyum, A. (2006). Inflation everywhere is a monetary phenomenon: An introductory note. The Pakistan Development Review, 45(2), 179–183.
Hasan, M. & Alogeel, H. (2008). Understanding the inflationary process in the GCC region: The case of Saudi Arabia and Kuwait. International Monetary Fund, Washington, DC. (IMF Working Paper 08/193).
Ilzetzki, E., Reinhart, C. M., & Rogoff, K. S. (2017). Exchange arrangements entering the 21st century: Which anchor will hold? National Bureau of Economic Research, Cambridge, MA. (NBER Working Paper 23134).
Jongwanich, J. & Park, D. (2008). Inflation in developing Asia: Demand-Pull or CostPush? Asian Development Bank, Manila. (ERD Working Paper Series 121).
Kandil, M. & Morsy, H. (2010). Fiscal stimulus and credibility in emerging countries. International Monetary Fund, Washington, DC. (IMF Working Paper 10/123).
Khan, M. S. & Schimmelpfennig, A. (2006). Inflation in Pakistan: Money or wheat? SBP Research Bulletin, 2, 213–234. State Bank of Pakistan, Research Department.
Khan, M. H. & Hanif, M. N. (2012). Role of demand and supply shocks in driving inflation: A case study of Pakistan. Journal of Independent Studies and Research, 10(20), 113–22.
Mishkin, F. S. (2008). Does stabilising inflation contribute to stabilising economic activity? National Bureau of Economic Research, Cambridge, MA. (NBER Working Paper 13970).
Melolinna, M. (2015). What has driven inflation dynamics in the Euro area: The United Kingdom and the United States? European Central Bank, Frankfurt am Main. (ECB Working Paper 1802).
Mohanty, M. S. & Klau, M. (2001). What determines inflation in emerging market economies? In Modelling aspects of the inflation process and the monetary transmission mechanism in emerging market countries, 1–38. Basel: Bank for International Settlements.
Mumtaz, H., Simonelli, S., & Surico, P. (2011). International co-movements, business cycle and inflation: A historical perspective. Review of Economic Dynamics, 14(1), 176–98.
Neaime, S. (2008). Monetary policy transmission and targeting mechanisms in the MENA region. Economic Research Forum, Giza, Arab Republic of Egypt. (ERF Working Paper 395).
Nguyen, A. D. M., Dridi, J., Unsal, F. D., & Williams, O. H. (2017). On the drivers of inflation in Sub-Saharan Africa. International Economics, 151(C), 71–84.
Osorio, C. & Unsal, D. F. (2013). Inflation dynamics in Asia: Causes, changes, and spillovers from China. Journal of Asian Economics, 24(February), 26–40.
Pain, N., Koske, I., & Sollie, M. (2006). Globalisation and inflation in the OECD economies. Organisation for Economic Co-operation and Development, Paris. (Working Paper 524).
Porter, N. (2010). Price dynamics in China. International Monetary Fund, Washington, DC. (IMF Working Paper 10/221).
Vašíček, B. (2011). Inflation dynamics and the new Keynesian Phillips curve in four central European countries. Emerging Markets Finance and Trade, 47(5), 71–100.


