Electricity Tariff Design: A Survey[1]
Pakistan’s tariff structure should be designed so that each consumer pays as per their service cost.
No more uniform tariffs.
Move from increasing block tariff to a flat linear tariff.
It will not only maximize revenues but minimize inefficiencies in the sector.
-
Introduction
In a perfectly competitive market, electricity is priced at the Marginal Cost (MC); MC pricing guarantees economic efficiency (Gunatilake, et al., 2008). In other words, efficient electricity tariffs consider all power supply costs. To a great degree, it also accounts for capital investments for future expansion and up-gradation (Kojima, et al., 2014). In a free market, market forces of demand and supply pushed for MC recovery.
In contrast, for a regulated market, the regulator sets the tariff according to the costs and reasonable return determined through the regulatory process. The regulator followed pre-determined guidelines, parameters, and standards set by the government; it may or may not be MC pricing. When a regulated tariff is set at a low level, it distorts the development/ functioning of the market at both the wholesale and retail levels.
“If regulated end-user prices are not in line with wholesale market conditions, suppliers without significant low-cost generation capacity or equivalent long-term contracts will not be able to make competitive offers that will allow them to recover their costs. Consequently, with a limited number of suppliers, there will be no development of the wholesale markets. Liquidity will remain at a low level. As a result, neither the wholesale nor retail markets will be competitive” (Cited from Suzzoni, 2009, p. 5)
The electricity tariff includes the operating and maintenance costs involved in generating, transmitting, and distributing electricity and a return on investment for a company engaged in these activities. Besides, it considers subsidies, surcharges, or taxes as per government policy, especially in the case of regulated tariffs.
This survey presents different electricity tariff structures and designs across countries. It heavily relies on regional and global surveys (Foster and Witte, 2020; AfDB-ERERA, 2019; and INNOGATE, 2015)[2]. On top, it reflects on Pakistan’s electricity tariff structure, identifies loopholes, and suggests a way to improve them.
___________________________
[1] Our thanks to Nadeem ul Haque for suggesting the topic and guiding us through the research.
[2] The information is mainly drawn from these studies, otherwise cited.
Table 1. Tariffs Followed Across Countries
2. Electricity Tariff Categories
Box 1. Tariff Categories
| There are four types of volumetric tariffs: Linear Tariff_ every unit consumed is charged the same rate. Increasing Block Tariff (IBT)_ unit rate increases with an increase in successive bands/blocks of marginal consumption stepwise. Decreasing Block Tariff (DBT)_ unit rate decreases with successive bands/ blocks of marginal consumption increasing stepwise. Volume Differentiated Tariff (VDT)_ linear tariff increases (or decreases) if total monthly consumption crosses a specific volume limit; otherwise, a single linear rate is charged. In some countries/ consumer categories, volumetric charges are accompanied by fixed load charges. Fixed Load Charges_ capacity rather than the energy consumed determines fixed costs on the power system. These are linear load charges per KW. Time-of-use Charges_ that apply multipliers to standard charges depending on consumption during peak or off-peak hours.These are linear but vary with time blocks. |
Across the world, a volumetric tariff is applied_ linear, and IBT structures are common (Table 1). The linear tariffs are generally applied to agricultural, commercial, and industrial consumers but are used less frequently for residential consumers, especially in developing countries. Load-based tariffs sometimes combine with other volumetric tariff structures in commercial and industrial schedules. For commercial and industrial customers, linear charges are modified by time-of-use factors and complemented with load-related fixed charges. Evidence suggests the simultaneous presence of various tariff designs in countries; variation is across sectors.
Tariffs with demand-based charges are more widely used for industrial and commercial and industrial customers but rarely exist for residential consumers and are more prevalent in high-income countries. In almost all countries where demand charges exist, these are linear load charges per kW.
Time-Based Rates are designed to reflect the real impact of the peak-hour load more accurately. It is designed to encourage customers to participate in reducing overall system costs or achieve other goals. Time-based rates (peak and off-peak) can provide more accurate price signals to customers, better reflecting the marginal cost of supplying and delivering electricity during specific day hours. These price signals may lead customers to change their consumption patterns to reduce peak and total consumption. It is common in industrial and commercial tariff schedules but rarely applied in residential tariff schedules.
In countries applying time-of-use blocks mainly consists of peak and off-peak hour blocks. Less common are broader divisions into day and night times and seasonal variation applied to those that do not use their facilities year-round (e.g., a cottage). Some of the modern utilities offer weekend /holiday rates to residential consumers. When time-of-use is practiced, unit charges during peak hours are almost double that of off-peak hours.
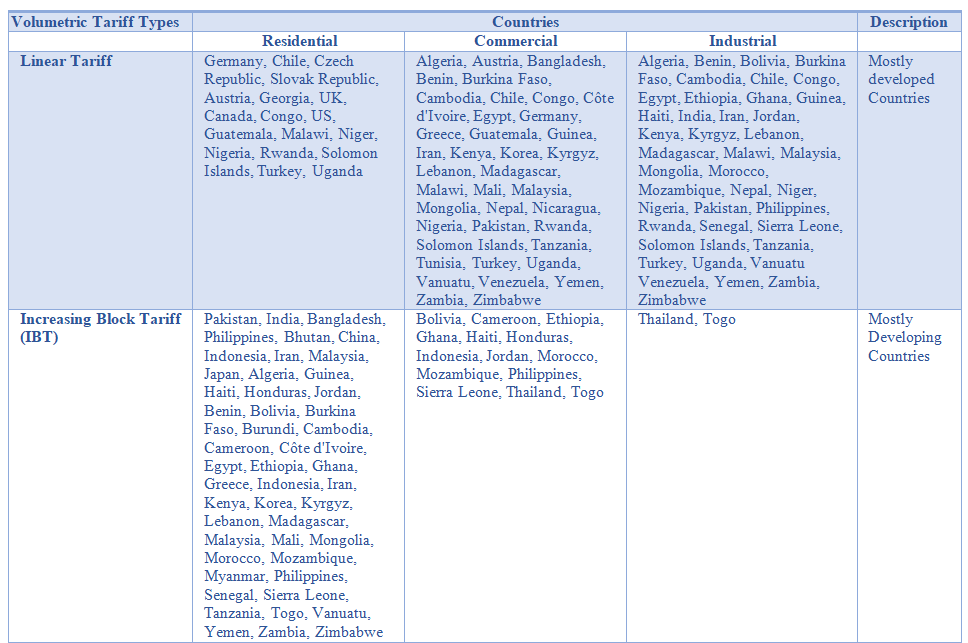
Increasing Block Tariffs (IBTs) are commonly applied to residential customers. These are designed to provide a social safety cover where all consumers can access electricity at an affordable tariff, including low-end consumers. In this tariff design, a shortfall in revenue is recovered from high-end consumers. The first block is usually priced to cover about 50 per cent or less of operating costs, while in the final block/blocks, the tariff applied is above the average operating expenses or actual cost of service. The design of IBTs varies with these blocks’ number, size, and unit price across countries applying this tariff design. The number of blocks incorporated in the residential tariff design varies from two to eight.
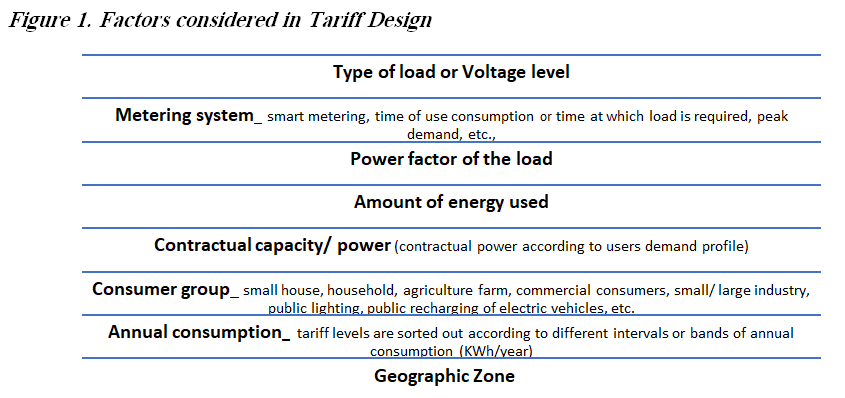
Apart from IBT, countries rely on other forms of complex volumetric design, including decreasing or non-monotonic block structures. Based on available information, Australia and Benin are the two countries found with evidence of DBT[3].
Energy tariff structures for each customer classification may be different but are designed (in general) to closely align them with the cost of service for that class. Tariff design is the process by which the cost of providing the services is allocated among the customers who use those costs. When designing a tariff mechanism, the following principles should be considered:
- Economic efficiency, i.e., a tariff ensuring MC recovery.
- Cost recovery, i.e., a tariff covering operating, maintenance, and capital costs.
- For users’ acceptance_ simplicity and transparency, i.e., easily understandable with transparent features.
- Non-discriminatory, i.e., a tariff which treats all users equally.
- Social affordability and political acceptance are other vital considerations requiring a gradual approach supported by transitional arrangements.
Generally, most of these considerations are not considered in developing countries with regulated tariff structures. But these are considered in countries (primarily developed countries) with well-established electricity markets.
_________________________________
[3] https://www.energy.gov.au/
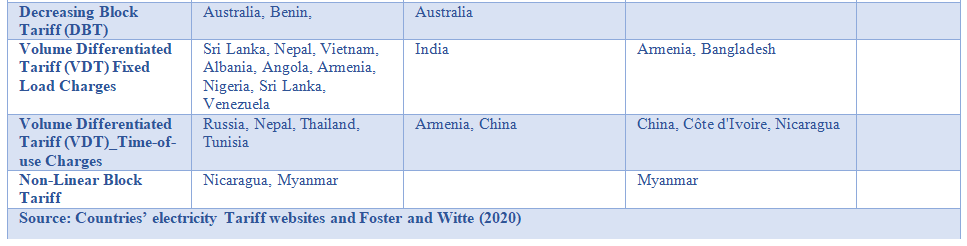
3. Tariff Structure
The electricity tariffs depend on the factors, as shown in Figure 1, but the combination of factors varies across countries. The last two factors are typically found in EU countries[4]. A single variable or a combination of these variables is used to allocate users to a given tariff category. For instance, in Denmark, Estonia, Romania and Slovenia, only the voltage level is used to allocate users to a certain consumer tariff category.
______________________________
[4] https://ec.europa.eu/energy/
Two-part or three-part tariff structures are commonly applied in many countries across the globe. The objective is to correctly reflect the cost of providing electricity to a particular consumer category. In the case of a two-part tariff, residential consumers have a fixed charge and a variable energy charge as recorded by the meter. For industry, a two-part tariff consists of a demand charge (capacity agreed in the contract) and the variable energy charge recorded by the meter. A two-part tariff is justified because it provides stability for the service provider, thus preventing large swings in revenue that may result from changes in usage conditions. On the consumer’s side, they may make better choices in their energy use under this tariff.
A three-part tariff is used only for specific consumer categories, e.g., bulk power consumers. The consumer electricity bill covers fixed costs (D), semi-fixed costs (Ax) and variable costs (By). That is,
C = Ax + By + D
Where C is the total charge for a period, x is the maximum (peak) demand during the period in units, and A is the cost per unit of maximum demand; y is the total energy units consumed during the period, and B is the total cost of energy units consumed; and D is the fixed charge during each billing period.
- The fixed costs typically include what the service provider incurs in reading meters, billing and collections, and a charge for the installation/ repair/ maintenance necessary to provide electricity service to the consumer.
- The energy costs vary depending upon the amount of energy consumed.
- The service provider incurs the demand costs in providing the peak load of the consumer at any given time during the billing period. The service provider incurs the costs of providing the facilities for meeting a designated peak load of the customer, regardless of whether the customer uses that peaking amount during the month or the year.
- Distribution tariff structures by user groups are different among countries.
In the African region and many Asian countries, the tariff includes fixed, capacity, and energy charges. The energy charge is further categorized as flat charge (a flat rate for all units consumed, irrespective of the level of consumption), consumption block (different prices applied to the KWh according to the consumption level) and TOU (different prices depending on the time of use).
Cross- subsidization across Consumer Groups
Cross-subsidization across various consumer groups is quite common. Evidence suggests that cost-recovery from a politically favored group, i.e., domestic and agriculture consumers, is challenging in developing countries. The tariff structures in most of these countries cross-subsidize domestic and agricultural consumption at the expense of industry and commercial users. Some residential tariff categories are about half or below industrial and commercial tariffs. At the same time, agricultural users tend to pay only about a fifth of what other user categories are charged.
In over 60 per cent of the countries (mainly low and middle income), industrial customers pay more than residential customers despite imposing likely lower costs on the system. Likewise, in almost 80 per cent of the countries, commercial customers spend more than residential customers despite imposing similar charges on the utility (Foster and Witte, 2020). In contrast, in the developed countries, e.g., in the United States, EU countries, Japan, and South Korea residential tariff rate is more than that of the industry, commercial and transport sectors[5].
__________________________________
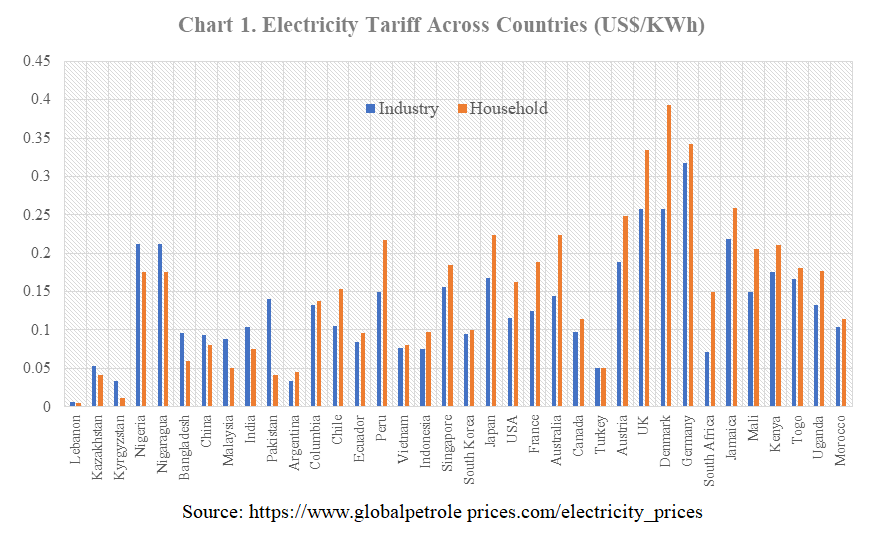
Even in some low- and middle-income countries that have prioritized their industrial growth, the industrial and commercial tariffs are lower than residential tariffs, for instance, Argentina, Peru, Indonesia, Vietnam, Columbia, South Africa, Morocco, and Kenya. Even some African countries like Mali, Rwanda, and Togo, with low income per capita, prefer productive business activities more by charging a lower tariff than household electricity tariff (Chart 1). It is beyond doubt that price variation across sectors creates horizontal injustice to the productive sectors of the economy.
Most countries cross-subsidizing domestic consumers apply increasing block tariffs (IBTs). There is a significant variation in tariff across tariff blocks or slabs within the same consumer category; the number of slabs also varies across countries. In other words, cross-subsidization within the sector as well. The aim is to protect the disadvantaged group of consumers against tariff hikes.
There is extensive evidence that IBTs are ineffective at protecting lifeline consumers. Even if they are effective in protecting them, it is at the cost of supporting those who may not necessarily fall into the low-income group (Komives et al., 2005). Cross-subsidization or IBTs yields positive results only when a higher percentage of poor households are connected to the grid (Huenteler, et al., 2017). Perhaps, the opposite is the case in actual practice in developing countries, where many rural poor are not connected to the national grid. Another issue common in African countries is that poor households often share meter/ connection to divide high upfront connection costs. This increases their total consumption, preventing them from taking benefits of lower slabs in IBTs (Kojima and Trimble, 2016).
Besides, IBT creates a deadweight loss relative to transfers_ such targeting of the poor is less effective than direct cash transfers for the poor. It has no cost basis and nurtures a conflict between efficiency and distributional goals (Borenstein, 2012). Non-linear electricity tariffs and taxation complicate economic decisions via charging varied marginal prices for the same good (Ito, 2014).
4. Tariff Regulation
Two types of cost-based tariff regulation are common[6]:
- Rate-of-return regulation_ assures the regulated company a specific pre-defined rate of return on its regulatory asset base.
- Cost-plus regulation_ provides a pre-defined profit margin to be added to the company’s costs.
There is little incentive to minimize costs in the rate-of-return regulation because a service provider can increase its profits by simply expanding the assets or cost base. Whereas, in cost-plus regulation, a company may have an incentive to signal incorrect costs to the regulator or waste resources to increase the cost base in extreme cases. Cost-based tariffs are based on assumptions and forecasts as tariffs are calculated for future periods. The regulator gauges the necessary costs based on the actual operation of the company but remains uncertain regarding the service provider’s efficiency.
- Incentive-based regulationwas developed to overcome shortcomings in cost-based regulation. The focus of this regulatory approach is on efficiency.
The United Kingdom (UK) was the first to introduce this approach. Later, followed by many other countries in developed countries and some developing countries like Pakistan and India before the privatization or intended privatization of network companies. This regulatory approach has been dependent on reliable data on costs and additional information for several years.
The overall policy towards energy pricing in the European Union and other developed countries is market-based wherever it is practical. Generation and supply procurement and tariffs are generally through a competitive market. Where regulated tariffs are applied, the underlying principles are that they should be fair, transparent, cover reasonable costs, allocate the cost efficiently between consumers, and provide for necessary investment and a valid return (INOGATE, 2015).
When most EU members have regulated tariffs, either rate-of-return regulation or cost-plus regulation were used. But now, these countries have switched to an incentive-based tariff. The objective is to incentivize performance, reduce the asymmetry of information between the regulator and the subject companies and improve the efficiency of the tariff-setting process. Yet, incentive-based regulation is effective only when the network companies are privately owned and the operational cost and asset valuations are fixed (INOGATE, 2015).
The tension between regulated and market-based tariffs can be removed once the tariffs are based on Marginal Costs (MC).
__________________________
[6] Cost of service regulation or average cost (AC) is primarily applied in developing countries with no competitive market. The apparent preference for cost-of-service regulation is the complexities in determining other pricing principles, e.g., MC pricing.
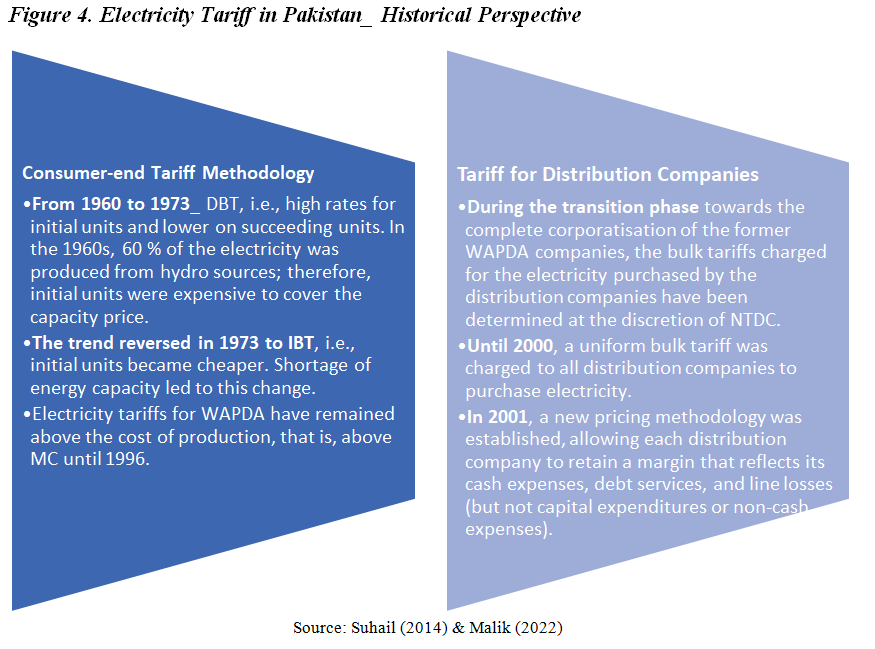
5. Electricity Tariffs in Pakistan
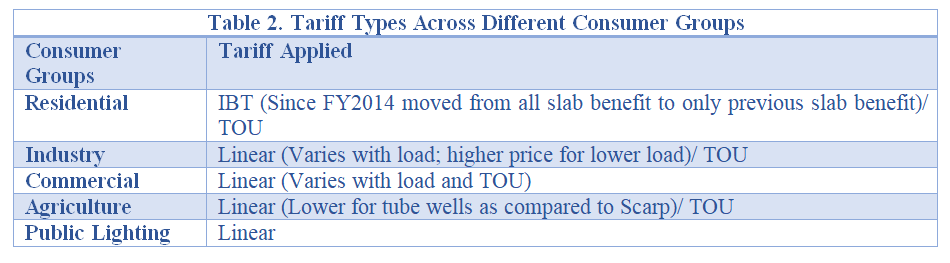
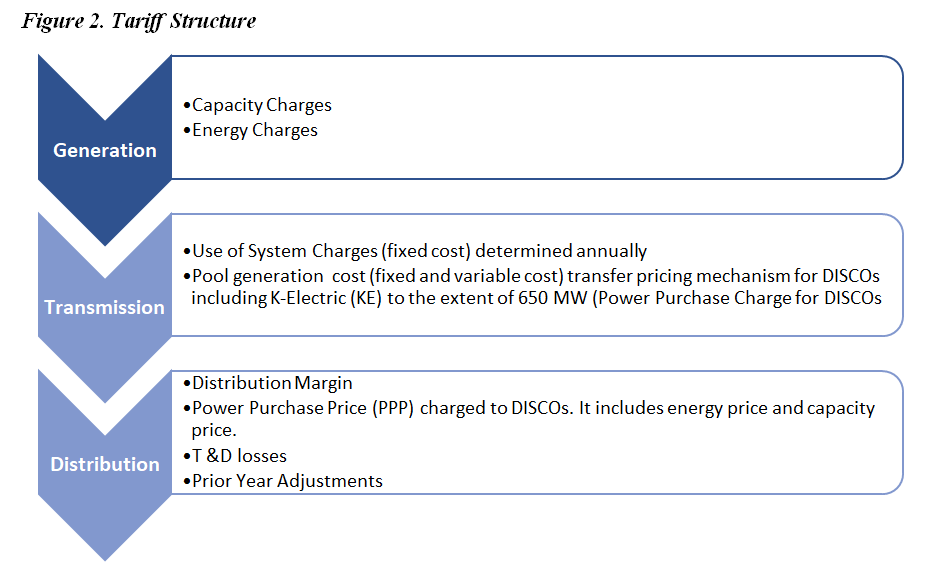
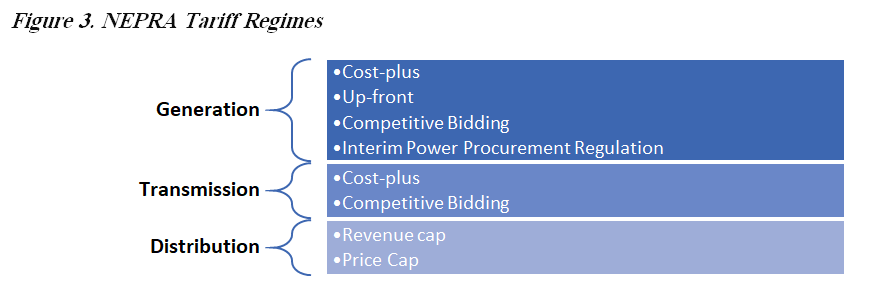
National Electric Power Regulatory Authority (NEPRA) determines electricity tariffs in Pakistan. Table 2 highlights the types of tariffs applied across various consumer groups. Figure 2 elaborates the tariff structure for generation, transmission, and distribution. Although the rules for competitive bidding in generation and transmission exist but are rarely applied, cost-plus and up-front are typically used. The tariff Regime/ Procedures followed are elaborated in Figure 3.
Multi-year tariff (MYT) regulatory framework was introduced for KESC in 2002 for seven years, given its expected privatization. Later, the same tariff regime was established for FESCO, IESCO and GEPCO, anticipating their privatization. The objective behind MYT is to obviate regulatory uncertainty and incentivize efficiency. Since March 2001, an automatic tariff Adjustment mechanism for fuel cost variations has also been adopted, applied every month.
6. Some Reflections on Pakistan’s Electricity Tariff Structure
The tariff structure in Pakistan is not based on regional and consumer-specific long-run marginal costs but political considerations. NEPRA determines consumer-end tariffs. In deciding the average sale price, NEPRA considers the annual revenue requirement of DISCOs which includes all the costs involved in the supply chain. The main factors in the annual revenue requirements or tariff determined include Power Purchase Price[7](a combination of Energy Purchase Price (EPP), Capacity Purchase Price (CPP)), Use of System Charges (UoSC) or market operator fee, net distribution margin[8], Transmission & Distribution (T&D) losses, and Prior-year Adjustments (PYA)[9].
_____________________________
[7] It includes the generation and transmission costs of the power a DISCO has projected to purchase.
[8] It is the difference between DISCOs gross margin and other income. Gross margin includes operation and maintenance (O&M) costs, depreciation and returns on the asset base of DISCO. Other income refers to remuneration of deferred credit, meter and rental income, late payment surcharge, profit on bank deposit, sale of scrap, income from non-utility operations, commission on PTV fees and miscellaneous incomes.
[9] It is the gap between the projected and the actual cost in the previous year, built into tariffs for that year. This adjustment is for the difference between the projected and actual electricity units purchased by DISCOs; the difference between the projected and actual distribution margins; the difference between actual and notified previous year adjustment; the difference between projected and actual other income; and the difference between the projected and actual consumption mix.
In addition, electricity utility bills are increasingly cluttered with taxes, fees, and surcharges. Consumers also pay:
- For investment in hydro projects, a Neelum Jhelum Surcharge of Rs 0.10 per unit.
- For servicing of circular debt parked in the Power Holding Private Limited, a financial cost surcharge of Rs. 0.43 per unit.
- Sales tax @ 17% per unit, electricity duty @ 1.5% per unit and a TV fee of Rs 35 per meter.
- Sales tax is also charged on fuel price adjustments. There are few additional taxes for non-filers of income tax.
These are charged irrespective of units consumed. The proliferation of these surcharges generally shifts risks away from utility operators/ investors and onto consumers. Besides increased costs to compliant consumers, surcharges can also result in more inefficiency in the distribution system. It reduces DISCOs’ incentives to improve and control costs. And in the case of the Neelum-Jhelum project, the surcharge shifts utility business risks away from investors and puts extra pressure on consumers (Malik, 2020).
As demonstrated in Chart 2, taking the weighted average of tariffs (WATF) across DISCOs, we find that consumers in distribution companies like IESCO, LESCO, FESCO, GEPCO and TESCO are subsidizing consumers of SEPCO, PESCO, HESCO and QESCO by paying more than their actual determined tariffs.
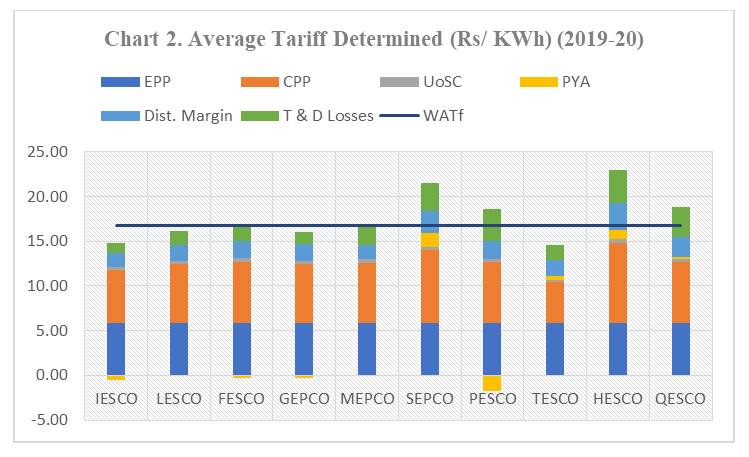
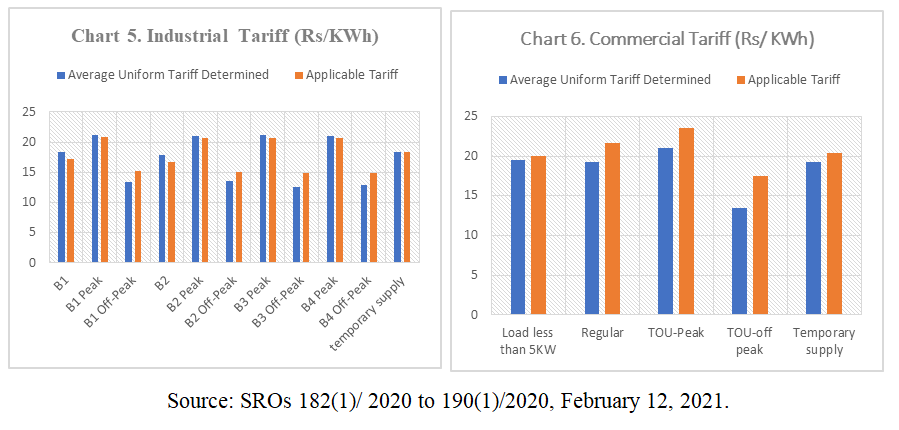
Source: SROs 182(1)/ 2020 to 190(1)/2020, February 12, 2021.
Note: WATF is the weighted average of tariffs across DISCOs, weights are based on units consumed.
Before the amendment to the NEPRA Act in 2018_ NEPRA determined consumer-end tariffs for each distribution company (DISCOs) separately. The tariff determined for each DISCO was different because of its distinct characteristics: the difference in annual revenue requirement and T & D losses (as evident in Chart 2). NEPRA evaluates cost and revenue requirements and sends its recommendation to the Government of Pakistan (GOP). The GOP notified the uniform tariff after adjusting for subsidies.
After the amendment to NEPRA Act in 2018_ NEPRA determines a uniform tax for distribution licensees wholly owned and controlled by a common shareholder based on their consolidated accounts, even though all distribution companies are separate corporate entities. This compromises the inefficient behavior of some of the DISCOs. The Government of Pakistan notified the final applicable tariff after adjusting for subsidies.
Subsidy & Cross-subsidy Across Sectors
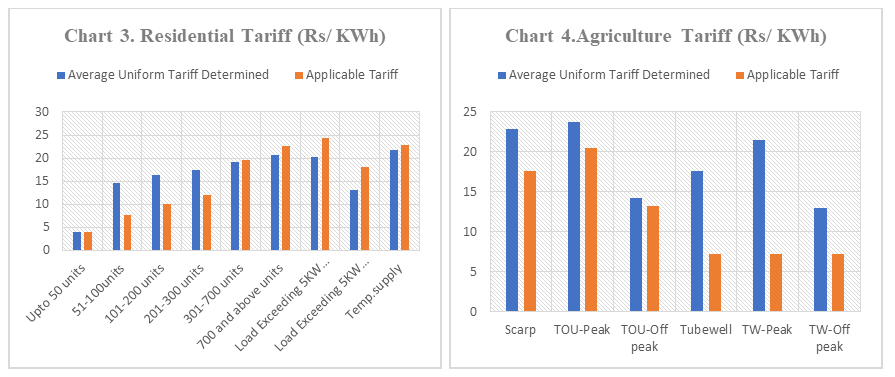
Uniform tariffs as determined by NEPRA, and the applicable tariffs as notified by the GOP are displayed in Charts 3 to 6. For the end-consumer, the current tariff structure is uniform throughout the country. Still, it distinguishes between residential, commercial, industrial, agriculture, and other customer categories. It is further divided by consumption level (tariff slabs), load, or time of use. The tariff structure is progressive for residential consumers. At higher consumption levels, it is more expensive. For residential consumers, the price of electricity is greater than the supply cost in the highest slab. But for agriculture tube wells, a tariff is linear and heavily subsidized.
The system of electricity subsidies, cross-subsidization across sectors and different geographical regions (DISCOs), and the inability to pass on the actual cost to some consumer categories are of great concern. Besides creating financial difficulties for the government, a tariff structure in which charges are not recovered from all consumer categories indiscriminately creates inefficiencies and misleads investment decisions in the supply system (Malik, 2020).
The Government of Pakistan provides several subsidies to the power sector. The most significant portion of this subsidy is for inter-DISCO tariff differential. Out of Rs 366.4 billion of electricity subsidy in FY2021, 55 per cent (Rs 201.8 billion) was for inter-DISCO tariff differential, and about 2 per cent (Rs 7.5 billion) was for Agriculture tube wells[10]. Since FY2007, the government has paid over Rs. 3.4 trillion as subsidies. Out of which about 75 per cent are for the policy to maintain the same tariff across the country. Due to fiscal constraints, the government can’t manage this subsidy amount in time. Thus, adding to circular debt. The consumer tariff notified in February 2021 created a financial gap of more than Rs 180 billion, to be covered through direct subsidies by the government. This is apart from tariff hikes due to fuel and other adjustments.
Apart from inefficient use of resources, some distortionary effects are associated with these subsidies and price structures. This welfare move discourages inefficient companies from improving their performance. Suppose a different tariff is charged in each DISCO. In that case, there will be pressure on companies like SEPCO, HESCO, PESCO and QESCO to improve, but companies like IESCO, GEPCO and FESCO would be able to sell electricity at a lower rate. Uniform tariff and subsidy policy burden compliant consumers through various surcharges, taxes, and tariff hikes.
________________________________
[10] Consumption of electricity in agriculture is about 9% of the total.
IBT (Non-linear Tariff) _ Domestic sector
Since 2013-14, the tariff structure has moved from all slab benefits to only a previous slab benefit. The residential consumers are given the advantage of one last slab. As we can see in Chart 3, for domestic consumers who consume up to 300 units of electricity, the applicable uniform tariff is much lower than the NEPRA determined uniform tariff. Moreover, whatever the government announces, an increase in tariff is only applicable to those who consume 300 plus units (most of the time). As per the tariff notification of February 12, 2021, 67 per cent of domestic consumers use electricity up to 300 units, while the remaining 33 per cent consume electricity above 300 units in Pakistan. In other words, 67 per cent of the consumption is below the weighted average cost of service. This government policy is meant to insulate the poor and the lower middle income (0-300 units) from the tariff hike.
Are all these 67 per cent poor and lower-middle-income households? About 46 per cent of the population is not connected to the national grid in rural areas. In urban areas, poor and lower-middle-income households that presumably consume (0-300 units) reside typically in congested localities. However, there are apprehensions that crowded areas mean more power theft (through meter-tempering) and line losses.
Moreover, there is ample evidence that the households opted for options to remain in lower slabs, for instance, two to three meters in a residential premise dividing load, meter tampering or electricity theft, or payment of a fixed amount to the lower staff of a company (Malik, 2020). So perhaps, this group is getting the subsidized tariff unnecessarily, increasing the burden for the government and the complaint consumers.
Unless or until tariffs are not allowed to cover the cost of providing electricity to consumers, the sector will continue to face financial difficulties. As Burgess et al. (2020) argued, the issue arises when we start treating electricity as a right rather than a private good. It leads to subsidies, theft, supply without payment, and losses for distribution companies, which may limit supply.
Cross-subsidization across Sectors
Over the years, a weak link between price and demand and substantive cross-subsidization has skewed consumption toward less-productive domestic consumers. Domestic consumption of electricity in FY2021 was more than 50 per cent. In comparison, the industry consumes 26 per cent. The industry relies on other energy sources due to expensive electricity from the national grid. In other words, the productive sectors that require a continuous supply of electricity either must restrict their production or rely on other sources when electricity service is considered a ‘right’ (Burgess et al. 2020).
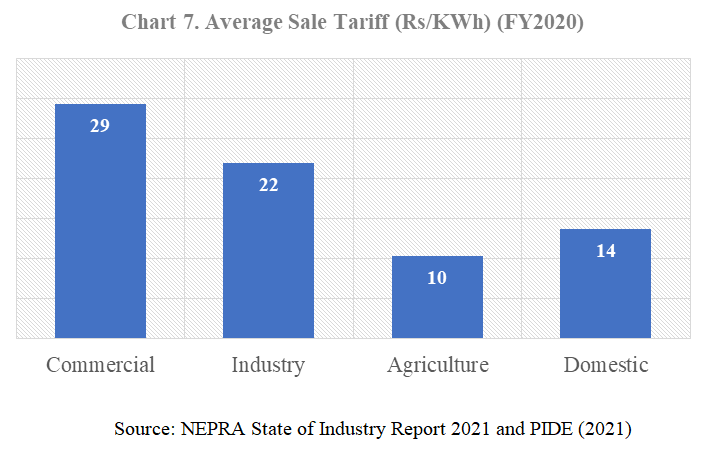
The unit cost of service to the industry is around Rs. 13.7/KWh for the year 2020 in Pakistan (PIDE, 2021). However, the average unit price charged to industrial units is around Rs. 21.90/kWh (Chart 7) during 2020[11]. There is a significant cross-subsidy from industrial and commercial consumers to agricultural and domestic consumers (below 300 units). Over the years, limited progress has been made in reducing cross-subsidies. Some of our low value-added exports rely heavily on electricity consumption. The high cost of electricity has reduced the competitiveness of our exports, thereby impacting the country’s trade deficit and balance of payment. Large cross-subsidies (especially in favor of domestic and agriculture consumers) and heavy tax incidence are contributing to grid defection by large consumers (industry, commercial and high-end consumers) ((cited from Malik (2022)).
The energy tariffs are high due to governance issues, operational, financial, and commercial inefficiencies, inapt policies, distortions in applicable tariff schemes, irrational cross-subsidies, and sub-optimal energy mix (Malik, 2020). The policymakers try to cover all these inefficiencies through subsidies or by charging a higher tariff to industry, commercial and high-end residential consumers. Over the last ten years, these subsidies have exhausted fiscal resources immensely, leaving little (in the form of PSDP) for the renovation or expansion of transmission and distribution infrastructure (SBP, 2019).
______________________________
[11] It is despite the subsidy rates to zero-rated industry.
7. Electricity Tariff and Power Sector Challenges
Tariff and Circular Debt Nexus
Consumer end tariffs are highly sensitive to the losses in the transmission and distribution (T&D) systems. With every percentage increase in losses, the tariff increases exponentially (as the generation cost increases). When a certain percentage of these losses are not accounted for in tariffs, it adds to the circular debt. Likewise, in tariff determination, NEPRA counts 100% recovery. However, the reported recovery percentage of DISCOs remained around 90% on average (Malik, 2020).
In 2021, T & D losses were equivalent to Rs 473 billion, Rs 402 billion were recovered through tariff, and a financial loss of Rs 71 billion was added to circular debt. Power sector loss from low bill recovery was Rs 39 billion in the same year. Unless or until tariffs are not allowed to cover the actual cost of service to consumers, the power sector will continue to face financial difficulties, and the circular debt will continue to rise.
It is estimated that a per unit increase in price by Rs 1 adds to an additional loss of more than Rs 10 billion; as it affects the paying capacity of consumers, that in turn will increase poverty, theft and delayed or no payment; increasing arrears (Faraz, 2018). Increasing tariffs will not resolve circular debt or power sector inefficiencies.
Moreover, as mentioned in the previous section, a significant portion of power sector subsidy is for inter-DISCO tariff differential. Due to fiscal constraints, the government cannot manage this subsidy amount in time, consequently adding to the sector’s deficit (that is, circular debt).
Tariff Design & Privatization of Distribution Companies
K-Electric is a privatized entity operating in a regulated environment. The same uniform tariff policy is applied to K-Electric consumers. The utility faces delays in tariff determination, delays in the disbursements of Tariff Differential Claims, and delays in receivables from the government departments (Malik & Khawaja, 2021). Thus, affecting the utility’s ability to pay back and increasing its payables to Rs 225 billion.
As per National Electricity Policy 2021, the uniform tariff policy will continue_ meaning the continuation of tariff differential subsidy. The privatization of state-owned distribution companies is on the GOP plan. A uniform tariff policy is no incentive for a privatized company.
Additionally, theoretically, it should have been relatively more straightforward for K-Electric as a privatized company to make investment decisions based on tariffs, to upgrade or replace distribution infrastructure. However, the company still needs regulatory approvals from NEPRA.
Tariff Structure & Independent Power Plants
Another shortfall associated with the current structure of tariffs and subsidies is shifting pressures away from inefficient power producers who continue to use more expensive fuels for thermal generation. For instance, as we can see in Chart 1, in the end-user NEPRA-determined tariff, the power purchase price (PPP=CPP+EPP) constitutes more than 73% (on average). The tariff notified by the government to subsidize households consuming up to 200 units is Rs 10.06 per KWh (Chart 2), which is much lower than the price at which DISCOs procure electricity from CPPA. This implies that while subsidizing power to end-consumers, the government pays not only for the inefficiencies at the DISCOs level; but for inefficiencies and excess capacities in the generation sector (Khalid, 2019). The current tariff/ subsidy policy led inefficient power producers to continue their ongoing practice.
Tariff Design and Market development_ CTBCM
The GOP is in the process of implementing the Competitive Trading Bilateral Contract Market (CTBCM). The ultimate objective of CTBCM is to generate competition among market players to benefit consumers in terms of service quality and pricing. There will be no competition when accounts of inefficient and efficient DISCOs are treated as one, and the uniform tariff is charged.
8. Way Forward for Pakistan
A tariff structure in which costs are not recovered from all consumer categories indiscriminately, besides creating financial difficulties for the government, also generates inefficiencies in the system and misleads investment decisions in the supply system (Malik, 2020).
In Pakistan, more than 60 per cent of electricity is produced by thermal sources providing costly electricity. Further, the tariff mechanism adopted provides electricity charges different across categories, time of use and sanctioned load etc., creating inefficiencies and making electricity expensive for productive sectors (industry and businesses) of the economy.
Pakistan is among the top thirty countries globally with relatively high tariff rates. Due to long-term agreements with guaranteed capacity payments to thermal generation companies, switching to cheaper indigenous energy sources is impossible in short to medium term. Therefore, the complex tariff mechanism needs to be revised to reduce electricity prices in Pakistan. The sector is about to implement a wholesale market model (CTBCM), demanding significant tariff reforms.
There should be fair pricing, where each consumer pays according to their consumption on a progressive trend, i.e., the more per unit energy is consumed, the more consumer pays on average.
- The best way is to move from increasing block tariff to a flat linear tariff. It will not only maximize revenues but minimize inefficiencies in the sector.
- Moving from a uniform tariff to a different flat rate across DISCOs will also minimize inefficiencies significantly.
- Tariffs should be based on the actual cost of services to all geographical markets.
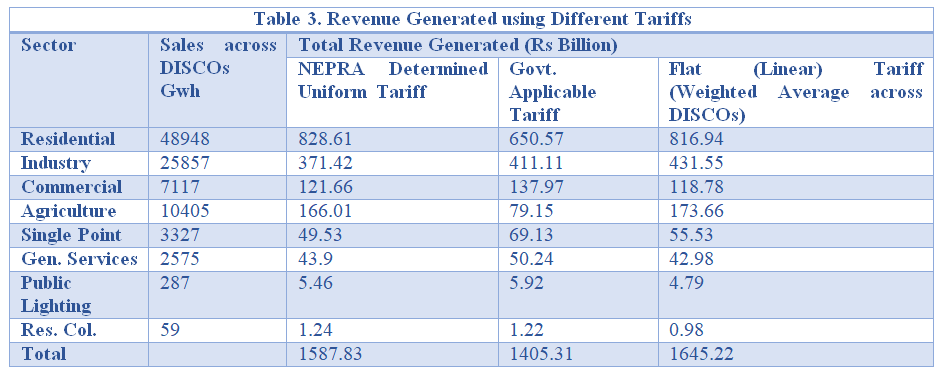
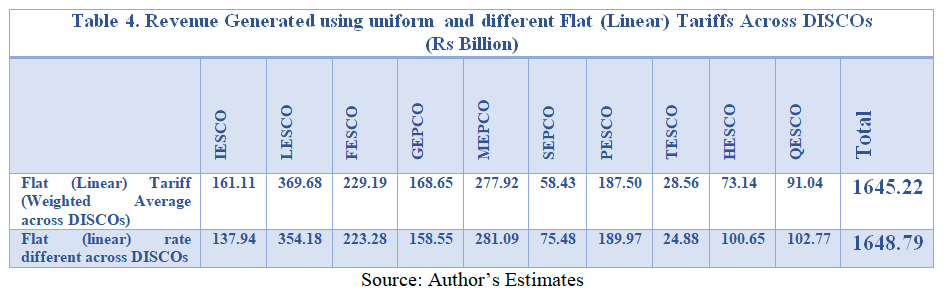
Based on data from Tariff Determination of February 12, 2021, total revenue is estimated for NEPRA determined uniform tariff, GOP applicable tariff, and for a flat (linear) tariff, i.e., the weighted average across DISCOs. Estimates are reported in Table 3 and Table 4. Maximum revenue is generated if we apply a linear (flat) rate which (in this case) is the weighted average across DISCOs[12], without any subsidy.
However, the flat (linear) tariffs may not be a win-win situation for all (e.g., poor households) but will reduce tariff-related distortions and inefficiencies. Empirical literature highlights that direct cash transfers, compared to electricity subsidies, have proved to be a better welfare alternative for low-end consumers (Borenstein, 2012; Khalid and Salman, 2020; and Awan, et al., 2019).
A tariff structure, as in Turkey, is the best option to adopt before moving towards a wholesale market structure. Our estimations also suggest that the sector would be better off adopting a linear tariff mechanism.
__________________________________
[12] Only a hypothetical exercise.
| Box 2. Tariff Structure in Turkey •A flat (linear) rate is charged for all consumption per consumer category (i.e., domestic, industry, agriculture and commercial). •Consumers can pay a single price or a variable price depending on the time of day using a smart meter. •All regulated tariffs are based on the cost of service, and there is no electricity subsidy for the low-income households or any other sector. •Turkey relied primarily on its social safety services to address the adverse impacts of electricity tariff reforms on low-income households. |
Empirical evidence also suggests that service provision is cheaper for the industry than domestic consumers. Besides, in countries prioritizing productive sectors, tariffs are lower for industry and business than domestic consumers. Currently, our billed demand is lower than the contracted generation capacity, increasing the capacity payment burden (CPPA, 2020). There is a need to increase billed demand to reduce the burden of capacity payments. In our exercise, we focus on the same (flat) tariff for all sectors. The option of a flat or linear tariff, different across sectors, as per their service cost, can also be considered, as in many European countries like Germany, Austria, and the UK.
- Increase billed demand by making grid electricity attractive to the productive sectors of the economy by offering them lower tariffs.
There is a need to re-visit the policy of imposing surcharges. A simplification of tariffs_ for every consumer category/geographical market is required. We need a tariff based on MC.
References
- AfDB-ERERA (2019) Comparative Analysis of Electricity Tariffs in ECOWAS Member Countries. Accessed at http://africa-energy-portal.org/
- Awan, H. S., G. Samad & N. Faraz (2019) Electricity Subsidies and Welfare Analysis: The Perspective of Pakistan. PIDE-Working Paper 2019: 164.
- Borenstein, S. (2012) The Redistributional Impact of Nonlinear Electricity Pricing. American Economic Journal: Economic Policy, Vol. 4, No. 3, pp. 56-90.
- Burgess, R., M. Greenstone, N. Ryan & A Sudarshan (2020) The Consequences of Treating Electricity as a Right. Journal of Economic Perspectives, Vol. 34, No. 1, pp.145-169.
- CPPA (2020) Annual Report, Central Power Purchasing Agency, Islamabad.
- Faraz, S. (2018) Circular Debt: Issues and Solutions. Report of the Special Committee on Circular Debt on Components of Circular Debt, Measures Taken & Required to Reduce the Same. Senate of Pakistan. Islamabad.
- Foster, V. and Witte, S. (2020) Falling Short_ A Global Survey of Electricity Tariff Design. Policy Research Working Paper 9174, World Bank, Washington, DC.
- Gunatilake, H., Perera, P., & Carangal-San Jose, M. J. F. (2008). Utility Tariff Setting for Economic Efficiency and Financial Sustainability —A Review. ERD Technical Note Series No. 24, Economics and Research Department, Asian Development Bank.
- Huenteler, J., Dobozi I, Balabanyan A. and Banerjee, S.G. (2017) Cost Recovery and Financial Viability of the Power Sector in Developing Countries: A Literature Review. Policy Research Working Paper 8287, World Bank, Washington DC.
- INNOGATE (2015) A Review of Energy Tariffs in INNOGATE Partner Countries. Accessed at http://www.inogate.org/
- Ito, K. (2010). Do Consumers Respond to Marginal or Average Price? Evidence from Nonlinear Electricity Pricing. University of California Berkeley Energy Institute at Haas Working Paper 210.
- Khalid, A. (2019) Why are Power Tariffs in Pakistan Consistently High? Special Section I, The State of Pakistan’s Economy, The State Bank of Pakistan.
- Khalid, S. A. & V. Salman (2020). Welfare Impact of Electricity Subsidy Reforms in Pakistan: A Micro Model Study. Electricity policy, Vol. 137, Issue (February).
- Kojima, M., Bacon, R., & Trimble, C. (2014). Political Economy of Power Sector Subsidies: A Review with Reference to Sub-Saharan Africa. The World Bank Group on Energy & Extractives, Washington DC.
- Kojima, M., Trimble, C.,(2016). Making Power Affordable for Africa and Viable for Its Utilities. The World Bank, Washington, D.C.
- Komives et al. (2005). Water, Electricity and the Poor_ Who Benefits from Utility Subsidies? The World Bank, Washington DC.
- Malik, A. (2020). Circular Debt: An Unfortunate Misnomer. PIDE Working Paper Series 2020: 20.
- Malik, A. (2022). National Electric Power Regulatory Authority (NEPRA), in Evaluations of Regulatory Authorities, Government Packages and Policies, Pakistan Institute of Development Economics (PIDE).
- PIDE (2021). Regionally Competitive Energy Tariffs and Textile Sector’s Competitiveness, Research Report, Pakistan Institute of Development Economics, March 2021.
- SBP (2019). Evaluating the Fiscal Burden of State-owned Enterprises in the Power Sector, Special Section 2, The State of Pakistan’s Economy, State Bank of Pakistan.
- Sohail, A. (2014). Review of energy sector with focus on electricity tariff determination, in solutions for energy crisis in Pakistan, Volume II.
- Suzzoni, P. (2009). Are Regulated Prices Against the Market? European Review of Energy Markets, Vol. 3, No. 3.