Synthesizing Evidence on Losses, Cost Recovery, and Financial Sustainability
Executive Summary
While net metering is largely celebrated as a clean-energy success story, the cost implications of this system on Pakistan’s struggling distribution sector are ignored. Drawing on regulatory data from the National Electric Power Regulatory Authority (NEPRA) and the existing literature, this Knowledge Brief summarizes evidence on the relationship between net metering/net billing, distribution losses and revenue recovery. The estimates show that even a small net-metering penetration (2 to 3% of sales) may exacerbate the financial distress of already loss-ridden and weakly recovering utilities. A Composite DISCO Stress Index calculated as a weighted average of losses, net-metering penetration and recovery performance reveals very strong heterogeneity: the stress is concentrated in the weakest base-line distribution utilities rather than in those with highest solar uptake. The evidence demonstrates that net metering is not to be examined separately from distribution-sector and fixed-cost recovery mechanisms.
1. From Net Metering to Net Billing
The power sector in Pakistan has suffered from poor cost recovery, high transmission and distribution (T&D) losses, and the accumulation of circular debt. Rooftop solar has witnessed a boom in Pakistan, primarily due to the ever-increasing electricity prices. The net-metered capacity has already crossed 5 GW, and the total distributed solar would be many times the number when off-grid and behind-the-meter systems are accounted for. It was expected to reach 6 GW by FY2024-25 (NEPRA, 2024). Since retail tariffs in many urban slabs touched the level of PKR 35–40 per unit and generation cost from solar was falling, rooftop solar turned out to be a rational hedge against rising electricity tariffs.
Net metering was initially introduced in September 2015 by the National Electric Power Regulatory Authority (NEPRA) through the Distributed Generation and Net Metering Regulations 2015 to incentivize renewable energy uptake, support distributed generation, relieve strain on the national grid, and provide consumers with a cleaner and potentially more affordable option. In this respect, the policy successfully accelerated rooftop solar deployment and private investment in renewable energy.
Under the previous net-metering regime, rooftop solar users in Pakistan received export credits at nearly retail-equivalent rates (around PKR 25–26 per kWh), effectively offsetting their grid consumption one-to-one. Under the Prosumer Regulations, 2026, exported electricity will now be purchased by distribution companies at the National Average Energy Purchase Price (NAEPP) of about PKR 10–11 per kWh instead of retail parity, significantly reducing the value paid for surplus generation.
Although net metering is predominantly being promoted as a renewable-energy and climate-mitigation tool, a growing body of international research warns that distributed generation may have non-neutral financial implications in power systems characterized by fixed costs and volumetric tariffs (Borenstein, 2017; Lazar, 2016). In Pakistan, these issues are further compounded by the poor quality of service of the distribution companies (DISCOs) and rate of recoveries that differ significantly from one region to the other (NEPRA, 2025). The inefficiencies in Pakistan’s distribution sector comprising high T&D losses, weak recoveries, poor governance and circular debt, existed long before rooftop solar adoption accelerated.
Adoption of rooftop solar in Pakistan has so far primarily been driven by consumers responding to the country’s unreliable electricity supply, escalating tariffs, and deteriorating service. In this context, this Knowledge Brief investigates whether net metering exacerbates the existing structural vulnerabilities in the power sector by disincentivizing billable sales in a system where a significant share of costs remains fixed.
The 2026 Regulations introduce four fundamental changes:
- Replacement of net metering with net billing (imports at retail tariff, exports at NAEPP)
- Capacity limits (DG capped at sanctioned load and transformer hosting threshold around 80%)
- Mandatory load-flow studies for systems ≥ 250 kW
- Time-bound approvals and 5-year renewable agreements with stronger regulatory oversight
2. Tariff Design and the Shift in Incentives
In the previous regime, a normal 10 kW residential system selling excess electricity at retail-equivalent rates enjoyed a payback period of about 4–5 years, based on their consumption patterns. Exports under net metering were credited at retail tariffs (typically in the range of PKR 25–30 per kWh depending on slab and category) which has now been reduced to PKR10-11/kWh reducing the annual export income by more than 50 percent. With the prevailing retail tariff, the payback period could be as high as 7 to 9 years[1] for import-reliant systems.
The impact is more pronounced for larger commercial systems (e.g., 100 kW and above), which typically generate peak output during midday hours, often resulting in surplus electricity relative to on-site demand (IEA, 2023). This increases incentives for battery integration. When a prosumer stores surplus electricity rather than exporting it, each stored unit displaces an imported unit worth PKR 40-55 instead of earning PKR 11. The Regulations therefore unintentionally encourage behind-the-meter storage adoption, accelerating a shift toward hybrid systems.
International evidence shows that net metering is most disruptive in systems with weak fixed-cost recovery and high losses (Burger & Luke, 2017; Darghouth et al., 2016). However, Pakistan-specific research remains limited in three areas i.e., long-term tariff incidence, equity impacts across income groups and interactions with circular-debt dynamics.
This analysis assesses the contributing factors to energy erosion[2] and distribution-sector strain by using data at the DISCO level on T&D losses, net-metering penetration, and revenue recovery. The aim is to determine whether it is the solar adoption per se or the vulnerabilities of the distribution system that are the major causes of financial strain.
Figure 1: Break-even Analysis under Net Billing: Role of Self-Consumption
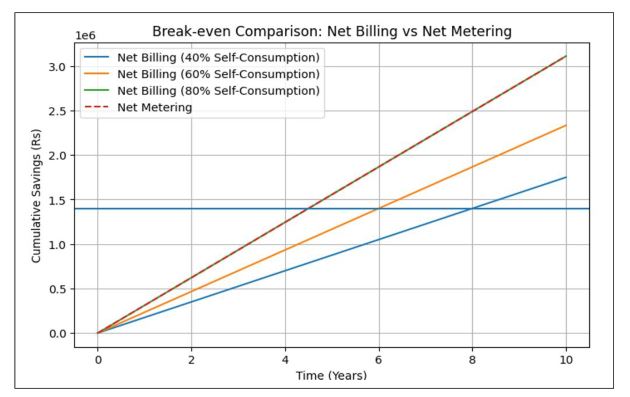
Source: Authors’ own calculations
3. Financial Stress in the Distribution Sector
This section evaluates how rooftop solar expansion interacts with existing distribution-sector vulnerabilities across Pakistan’s DISCOs. This brief does not attempt to establish a direct causality between net metering and DISCO inefficiency; rather, it assesses whether the financial effects of net-metered exports become more significant in utilities already characterized by high losses and weak recoveries.
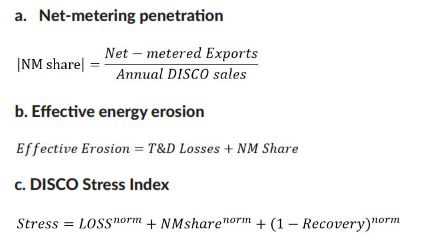
An accounting-based, comparative analytical tool is used to evaluate the relationship between net metering and financial distress in the distribution sector in Pakistan using DISCO-wise net-metered exports (kWh), T&D loss rates (%) and recovery ratios (%) from NEPRA, State of Industry Report (2025). To estimate the system fragility, the analysis develops three indicators: net-metering penetration, effective energy erosion (T&D losses and net-metering penetration), and a composite measure of DISCO Stress Index that combines normalized values of losses, net-metering penetration, and revenue recovery. This composite metric strategy bears similarity to dominant approaches in measuring financial resilience and stress (Jenkins & Sepulveda, 2017; Joskow, 2006) in electricity utilities experiencing demand erosion and fixed-cost recovery problems.
Figure 2: DISCOs Coverage in Pakistan
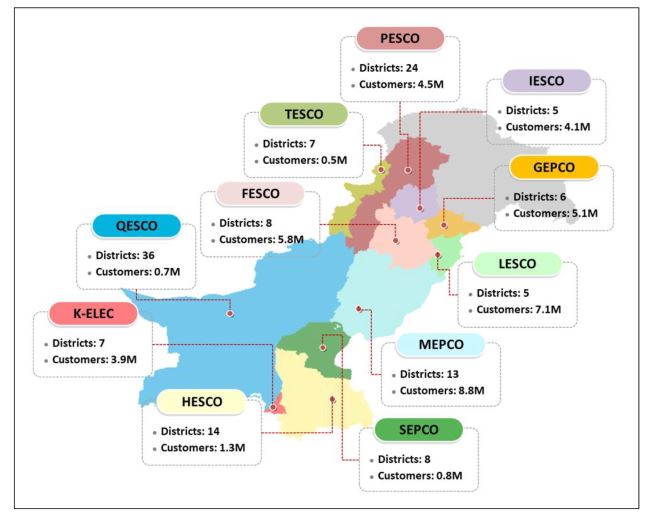
Source: Authors’ mapping using ArcGIS and NEPRA (2025) data
Three indicators are constructed at the DISCO level:
This composite approach follows established practice in electricity-economics and resilience studies (Jenkins & Sepulveda, 2017; Joskow, 2006). The objective is not causal inference but systematic comparison of exposure across utilities. Net-metering penetration remains moderate overall but exceeds 2–3 percent of DISCO sales in several utilities, particularly LESCO, FESCO, GEPCO, and MEPCO (NEPRA,2025).
Figure 3: Effective Energy Erosion (Losses + Net Metering)
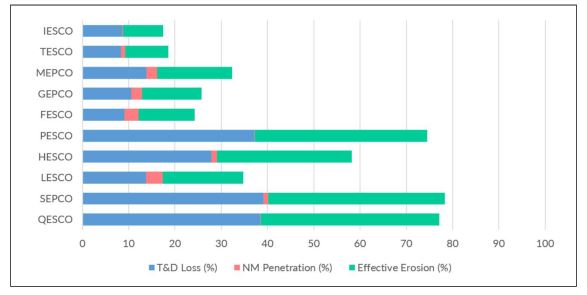
Source: NEPRA (SOIR), 2025
Financial stress remains highest in DISCOs characterized by weak recoveries and high T&D losses, while net-metering penetration varies considerably across utilities. The results imply that rooftop solar does not independently create structural weaknesses in DISCOs, but rather interacts with existing structural weaknesses. These findings show that net metering is a system-wide phenomenon, but its financial effect is skewed within Pakistan’s distribution companies. Net-metered net exports in FY2024–25 stand above 1.9 TWh, implying that around PKR retail 54 billion revenue is at risk when applied with a uniform average tariff of PKR 26.5/kWh (NEPRA, 2025) while under net billing it reduces to 22 billion with a uniform tariff of PKR.11.
Table 1: Revenue Exposure & Stress Index Ranking
| Rank | DISCO | Net Exports (GWh) | Revenue Exposure under Net-Metering (PKR bn) | Revenue Exposure under Net-Billing (PKR bn) | Stress Index (0–3) |
| 1 | QESCO | 3.18 | 0.08 | 0.03 | 2.21 |
| 2 | HESCO | 48.28 | 1.28 | 0.53 | 1.52 |
| 3 | SEPCO | (24.51) | -0.65 | -0.27 | 1.42 |
| 4 | PESCO | 9.85 | 0.26 | 0.11 | 1.31 |
| 5 | LESCO | 840.34 | 22.27 | 9.24 | 1.17 |
| 6 | FESCO | 448.42 | 11.88 | 4.93 | 0.90 |
| 7 | MEPCO | 391.96 | 10.39 | 4.31 | 0.89 |
| 8 | GEPCO | 249.84 | 6.62 | 2.75 | 0.77 |
| 9 | TESCO | 13.96 | 0.37 | 0.15 | 0.56 |
| 10 | IESCO | 16.01 | 0.42 | 0.18 | 0.25 |
| Total | 1,997.33 | 52.93 | 21.97 | ||
Source: Authors own calculations *High (SI > 2), Moderate (1 < SI ≤ 2), and Low (SI ≤ 1)
The results indicate that net metering alone cannot explain the financial difficulties experienced by DISCOs. The conventional structural drivers of inefficiency including consumption loss, theft, poor recoveries, deferred investments and tariff distortions continue to dominate. In many cases, the decision to install solar on the roof may itself be a consumer response to unreliable supply and escalating electricity prices. Accordingly, net metering should be viewed as one element that can exacerbate the finances of certain utilities, and it is not the primary driver behind the financial distress being experienced in the distribution sector.
While the penetration of net metering is still modest as a percentage of total DISCOs sales, the financial effects are more significant in utilities that are already operationally and financially weak. In DISCOs with high losses, like QESCO, PESCO, HESCO and SEPCO, the energy erosion impact (T&D losses plus net-metering penetration) is 29–39 percent, indicating that, financially-enabled, self-generation may reinforce existing financial stress rather than offset underlying operational inefficiencies.
A composite DISCO Stress Index characterizes QESCO as the most financially stressed DISCO followed by HESCO, SEPCO, and PESCO, mainly because of high T&D losses and poor recovery. However, IESCO and TESCO depict relatively less stress because of better operational performance and lesser relative exposure. In line with the fixed-cost-recovery literature, the results further reveal that net metering leads to a mechanical increase in per-unit capacity charge by PKR 0.1–0. 5/kWh, contributing to tariff-spiral dynamics in the already fragile distribution system (Borenstein, 2017; Lazar, 2016; Joskow, 2006). Broadly, outcomes indicate that the net metering financial impact in Pakistan is not uniform across the system rather it depends on the underlying structural conditions of the DISCOs.
4. Conclusion & Way Forward
Net billing might decrease the amount of financial transfer included in the retail-equivalent export compensation, but it does not address the fundamental structural problems in Pakistan’s power sector. High T&D losses, poor recoveries, tariff distortions and circular debt continue to be the main cause of DISCO stress. The results of this Knowledge Brief indicate that rooftop solar may amplify these weaknesses to differing degrees across utilities especially where financial and operational performance is already fragile.
The annual retail revenue loss is estimated to be PKR 54 billion, compared with about PKR 22 billion under net billing, implying a reduction of nearly PKR 32 billion in export-credit payments. Results show that the impact of net metering is more tied to specific, underlying distributional inefficiencies than solar penetration. Lower export remuneration could incentivize consumers to invest in batteries and hybrid systems to increase self-consumption instead of exporting electricity to the grid. This may ease immediate export pressure off the DISCOs, but at the same time it could also accelerate reduced dependence on the grid among higher-income consumers, further reducing the sales base over which fixed system costs are recovered. When prosumers store surplus daytime generation instead of exporting it at around PKR. 11/kWh, DISCOs lose not only export settlement gains but also evening and peak-hour electricity sales, which are typically more valuable from a revenue perspective. In this sense, net billing may alter the form of financial pressure on DISCOs rather than eliminate it, potentially deepening volumetric sales losses over time. This underscores the need for a more balanced policy response, with the following suggestions being critical in guiding the system towards better sustainability and efficiency:
a. Prioritize reduction in DISCO losses and recovery gaps alongside solar reforms. Net metering was not a cause of inefficiency in Pakistan’s distribution sector which predated any rooftop solar penetration. Thus, the reforms must be focused on (i) theft reduction, (ii) increased recoveries, (iii) upgraded bill collection systems, sand (iv) governance and management of weak DISCOs. Given such systemic challenges, shifting from net metering to net billing will result only in a short-term financial relief as the root level inefficiencies will remain.
b. Implement net billing gradually through a transparent and predictable export-pricing framework. Alignment of export compensation with avoided energy costs can alleviate DISCOs revenue challenges and minimize cross-subsidization of non-solar consumers. Severe reductions in export prices would lengthen solar payback periods, discourage future rooftop investment and create confusion among consumers and investors. A phased transition can provide a good balance between ensuring financial viability and maintaining ongoing renewable-energy penetration.
c. Integrate rooftop solar expansion with feeder-level planning and preparation for hybrid systems. Lower export remuneration in the net billing scheme may also push consumers to increase self-consumption using batteries/hybrid systems and decrease the amount of electricity exports to the grid. Accordingly, future planning need to combine DG with feeder-level studies, network upgrades, and storage deployments in a manner that allows for elevated solar penetration levels to improve reliability and affordability.
References
Alternative Energy Development Board. (2015). Net-metering reference guide for electricity consumers and installers: How to get your solar system connected to the national grid in Pakistan for net metering. Government of Pakistan.
Borenstein, S. (2017). Private net benefits of residential solar PV: The role of electricity tariffs, tax incentives, and rebates. Journal of the Association of Environmental and Resource Economists, 4(S1), S85–S122.
Brown, D. P., & Sappington, D. E. M. (2017). Optimal policies to promote efficient distributed generation of electricity. Journal of Regulatory Economics, 52(2), 159–188. https://doi.org/10.1007/s11149-017-9335-0
Burger, S. P., & Luke, M. (2017). Business models for distributed energy resources: A review and empirical analysis. Energy Policy, 109, 230–248. https://doi.org/10.1016/j.enpol.2017.07.007
Darghouth, N. R., Barbose, G., & Wiser, R. (2011). The impact of rate design and net metering on the bill savings from distributed PV for residential customers in California. Energy Policy, 39(9), 5243–5253. https://doi.org/10.1016/j.enpol.2011.05.040
International Energy Agency (IEA). (2023). Renewables 2023: Analysis and forecast to 2028. Paris: International Energy Agency. https://www.iea.org/reports/renewables-2023
Jenkins, J. D., & Sepulveda, N. A. (2017). Enhanced decision support for a changing electricity landscape: The GenX configurable electricity resource capacity expansion model. Massachusetts Institute of Technology.
Joskow, P. L. (2006). Patterns of transmission investment. In F. P. Sioshansi & W. Pfaffenberger (Eds.), Electricity market reform: An international perspective (pp. 131–145). Elsevier.
Lazar, J. (2016). Teaching the “duck” to fly (2nd ed.). Regulatory Assistance Project. https://www.raponline.org
National Electric Power Regulatory Authority (NEPRA). (2024). State of Industry Report 2023–24. Islamabad: Government of Pakistan.
National Electric Power Regulatory Authority (NEPRA). (2025). State of Industry Report 2024–25. Islamabad: Government of Pakistan.
Walker, T. F., Canpolat, E., Khan, F. K., & Kryeziu, A. (2016). Residential electricity subsidies in Pakistan: Targeting, welfare impacts, and options for reform (World Bank Policy Research Working Paper No. 7912). World Bank.
[1] With 60 percent of self-consumption and an export rate of PKR 11.
[2] Reduction in billable electricity sales