
Key Message
Managing speed limits on national highways and motorways offers a quick, low-cost way to cut fuel demand. It won’t close the gap by itself, but as part of the National Conservation Strategy, it saves fuel and foreign exchange, make roads safer, and can be put in place almost immediately, without new spending or infrastructure.
Executive Summary
The US-Iran war conflict has disrupted global energy markets amid the closure of the Strait of Hormuz, through which roughly one-fifth of global oil supply passes. As a result, oil prices have become more volatile, and import-dependent economies like Pakistan face higher energy security risks. Given that, Pakistan government has lowered the maximum speed limit for light and heavy vehicles on motorways and national highways, as one of the government’s precautionary fuel conservation measures.
This policy view estimates the total fuel saved by these lower speed limits. Using traffic counts for the main motorways and highways, national fuel consumption data and the International Energy Agency’s (IEA) estimates on speed and fuel consumption, the central estimate is a saving of about 141 million litres of petrol and diesel a year, worth about Rs 56 billion at the pump prices of 3 October 2026 and about US$ 134 million in import costs. The study estimates total fuel savings range from about 28 million to 332 million litres (Rs 10.9 billion to Rs 131 billion), depending upon on how far drivers actually slow down. These figures are indicative scenario estimates rather than forecasts, depend on the behavioural assumptions set out in Section 4.3 and on the degree of compliance. Further the low and high values depict alternative scenarios, not the statistical confidence bounds.
The central saving equals about 0.8% of annual road fuel (petrol and diesel) use and about 0.9% of the FY2024-25 petroleum import bill (US$ 15.0 billion). This measure is therefore helpful but modest on its own. Its value lies in its low cost, road safety benefits and speed of implementation. The result depends mainly on enforcement: at full compliance, the central saving would be close to 218 million litres. Speed limits should be combined with other fuel demand conservation measures, such as eco-driving for freight, remote working and better public transport, to have a larger effect.
| Estimate (per year) | Low | Central | High |
| Fuel saved (million litres) | 28 | 141 | 332 |
| Value at pump prices (Rs billion) | 10.9 | 55.8 | 131.0 |
| Import cost saved (US$ million) | 26 | 134 | 313 |
Source: Authors’ calculations
Background and Context
The transport sector is by far the largest consumer of petroleum products in Pakistan, hence making it a natural target for fuel conservation during an oil supply disruption. Road transport accounts for almost 96.9% of total transport sector fuel consumption, using 14.53 million tonnes of petroleum products in Jul-Jun FY2025-26 (Table 1), 1.2% more than in the same period of FY2024-25.
Figure 1: Transport is 93% of domestic Petroleum demand
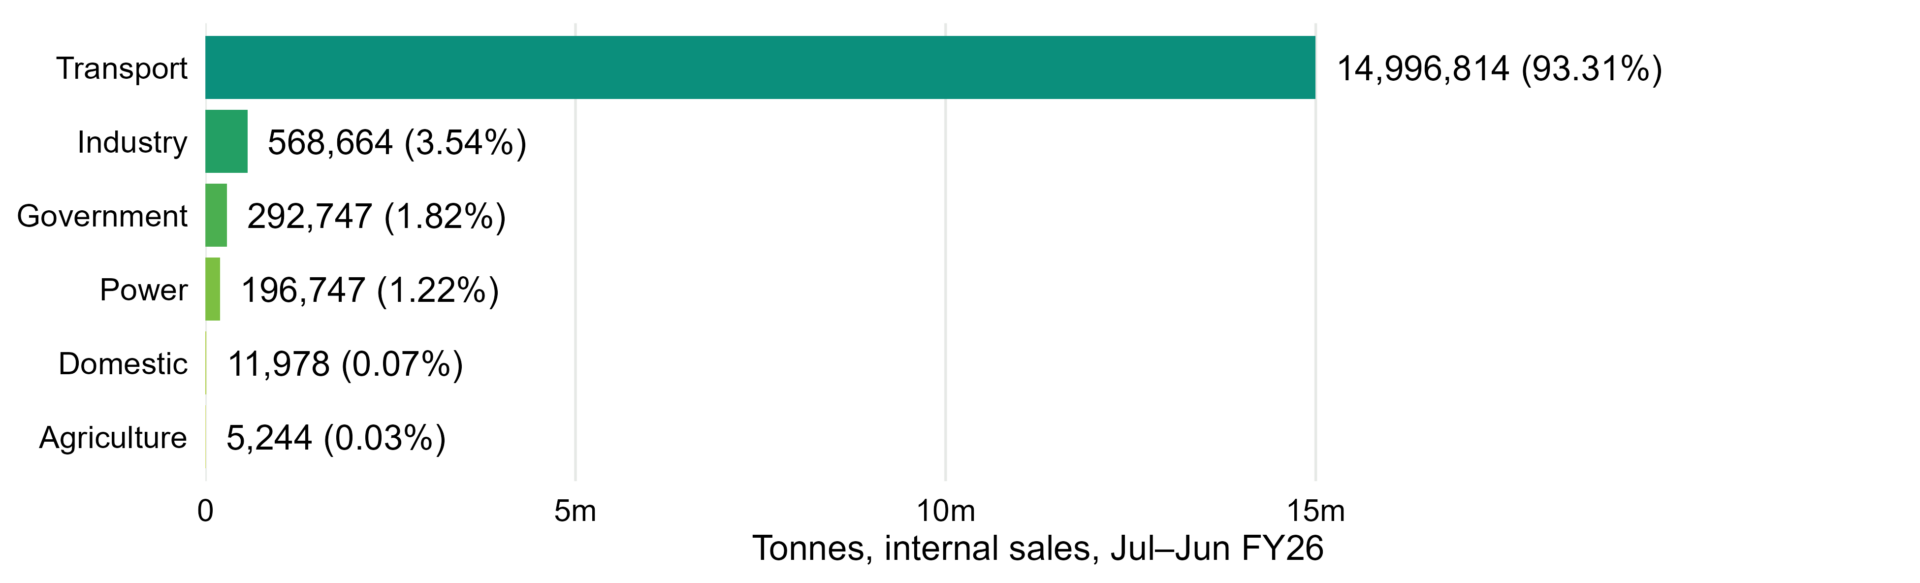
Source: OCAC / HDIP. Energy products (Metric Tonnes) , Jul–Jun 2025-26.
Table 1: Consumption of Energy (Petroleum) Products by Transport (tonnes)
| Mode | HOBC | Motor spirit | JP-1 | HSD | Fuel oil | Jul-Jun FY26 | Jul-Jun FY25 |
| Road | 315,496
|
7,803,966 | 6,413,558 | 134 | 14,533,293 | 14,364,228 | |
| Railways | 108,520 | 188 | 108,708 | 115,201 | |||
| Domestic bunkers | 3,072 | 541 | 3,613 | 2,568 | |||
| Domestic aviation (PIA) | 159,682 | 159,682 | 169,238 | ||||
| Domestic aviation (others) | 191,504 | 14 | 191,518 | 194,084 | |||
| Total transport | 315,496 | 7,803,966 | 351,186 | 6,525,150
|
877
|
14,996,814 | 14,845,318 |
Source: OCAC / HDIP
Motor spirit (petrol) is the main fuel for cars and other light vehicles, while high-speed diesel (HSD) powers most trucks, buses and freight. The fuel mix is heavily concentrated in Motor spirit (7,803,966 metric tonnes) and high-speed diesel (6,525,150 metric tonnes), which together make up 95.5 per cent of total transport fuel consumption. Any movements in the transport sector’s total share are, in practice, movements in these two products’ share. Jet fuel (JP-1, 351,186 metric tonnes) and HOBC (315,496 metric tonnes) each account for roughly 2 per cent, and fuel oil is only 877 metric tonnes (Figure 2).
Figure 2: Transport Runs on Two Fuels
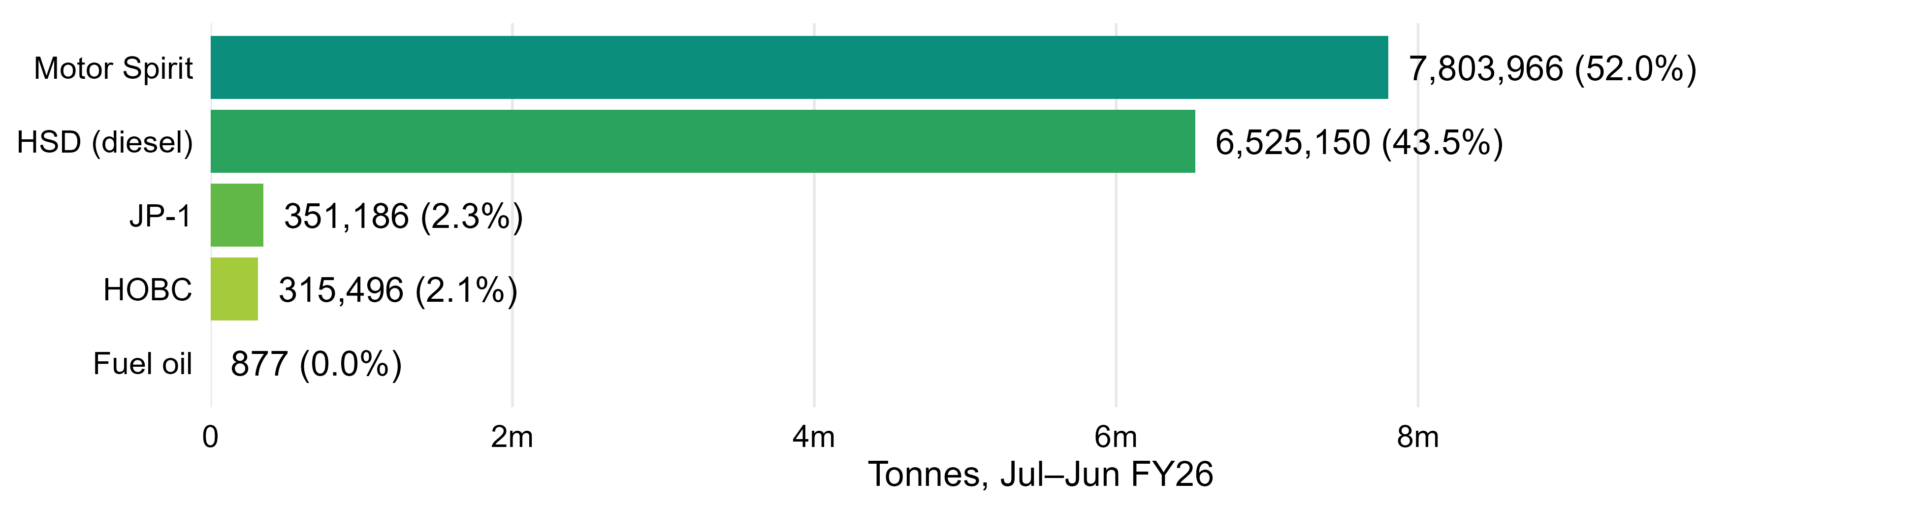
Source: HDIP / OCAC. (Metric tonnes)
Rising Population and Rising Vehicle Demand
Although Pakistan’s population and cities are growing at large, however, the number of vehicles, especially privately owned vehicles, is growing at a much faster rate. According to the 2023 Population Census, the population rose from 177.1 million to 241.5 million (36%), and the urban population rose from 66.4 million to 93.9 million (41.4%) during FY2011 to FY2023. However, the number of vehicles on roads rose from 10.4 million to 35.9 million in FY 2023, witnessing an increase of 243.8% during the same period (Figure 3). Several factors, such as population growth, urban sprawl, auto financing, and insufficient public transport, contribute to this trend (Qadir and Batool, 2026).
Figure 3: Population and Vehicles on Road (index, 2010-11 = 100)
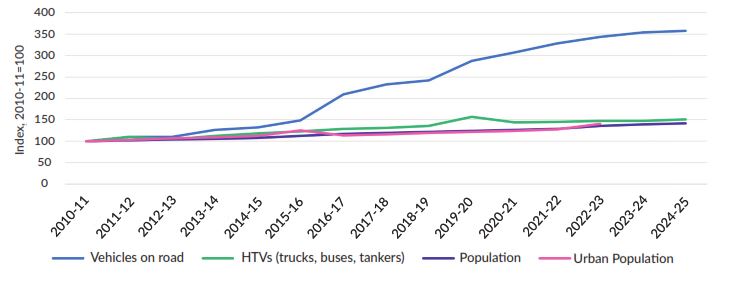
Source: Pakistan Economic Survey 2025-26.
Figure 4 shows light transport vehicles (LTVs: including cars, jeeps, station wagons, taxis, delivery vans and pickups), number about 6.4 million (15.6% of the total), and heavy transport vehicles (HTVs: including trucks, buses, tankers, tractors and ambulances), are 1.3 million (3.2% of total vehicles on roads). The remaining 0.3 million vehicles (0.7%) are listed under others. Motorcycles are not allowed on motorways and their limits were not changed, so the estimates below cover LTVs and HTVs only.
Figure 4: Vehicle Fleet by Type, July–March 2025-26 (% of total)
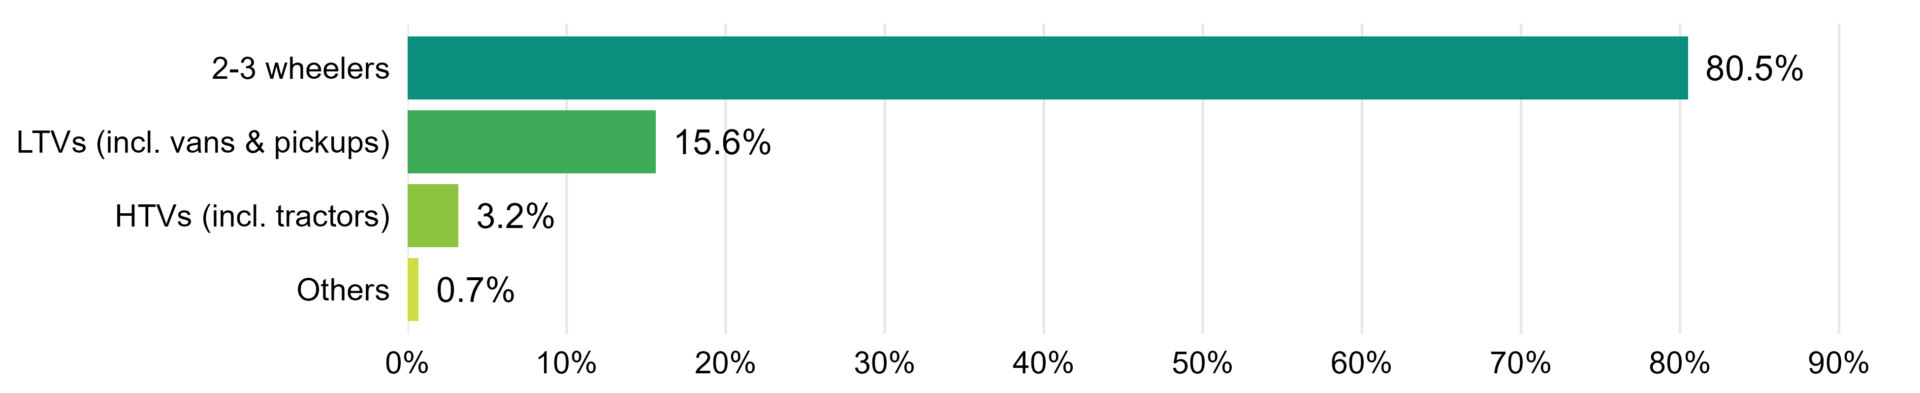
Source: Pakistan Economic Survey 2025-26, Table 13.4 (Motor Vehicles on Road, July–March 2025-26). LTVs include delivery vans and pickups; HTVs include tractors and ambulances.
The Speed and Fuel Efficiency Relationship
Many factors affect a vehicle’s fuel consumption: vehicle type and weight, engine size, driving style, maintenance, tyre pressure, load, air conditioning and road conditions etc. Aggressive driving with rapid acceleration and hard braking uses much more fuel than smooth driving, and under-inflated tyres and poor maintenance make engines work harder. Among the factors a government can influence quickly, speed has one of the largest effects. Air resistance rises with the square of speed and dominates fuel use at highway speeds, so each additional 10 km/h costs more fuel than the last. Research on this link gained prominence after the first oil shock of the 1970s. Lower speed limits are a tried policy response. During the 1973 oil crisis, the French government lowered limits to 90 km/h on ordinary roads and 120 km/h on motorways, and France again encouraged slower driving as part of its response to the 2022 energy crisis. Table 2 sets out the revised limits by road type and vehicle category.
Table 2: Revised Speed Limits on Motorways and National Highways
| Road type | Vehicle category | Previous limit (km/h) | Revised limit (km/h) | Reduction (km/h) |
| Motorways | Cars / LTVs | 120 | 100 | 20 |
| Motorways | PSV / HTV | 110 | 90 | 20 |
| National highways | Cars / LTVs | 100 | 80 | 20 |
| National highways | PSV / HTV | 80 | 65 | 15 |
Source: National Highways & Motorway Police.
The IEA’s March 2026 report Sheltering from Oil Shocks finds that reducing highway speed by 10 km/h cuts an individual car driver’s oil use by 5% to 10%, and that such speed limit reductions may lower national oil use for private cars by 1% to 6%. Heavy freight trucks save less from a 10 km/h cut because they already travel more slowly, but because they drive on highways much more, each heavy truck can still cut oil use by around 5%. The measure reduces diesel demand through trucks and petrol demand through cars and light commercial vehicles, where about 85% of oil use is gasoline.
The IEA coefficient is expressed per 10 km/h, while the revised limits are cut by 15 to 20 km/h and the average speed reductions assumed in Section 4.3 are 10 to 15 km/h. In the estimates below the coefficient is scaled linearly to the assumed average speed reduction, so that a 15 km/h reduction is treated as 1.5 times the saving per 10 km/h. This is an approximation rather than an estimated relationship. Because fuel use rises roughly with the square of speed, linear scaling probably understates savings at the top of the speed range and overstates it at lower speeds; it is used here because no coefficient estimated on Pakistani traffic is available.
Estimating the Fuel Savings
Estimation Framework
Fuel is saved only on the kilometres that vehicles actually drive on motorways and national highways, only by drivers who were going faster than the new limit, and only to the extent that they comply. The estimate therefore works segment by segment (LTVs and HTVs on motorways and on highways):

where Fs is the fuel used on the network by the segment, e is the share of its vehicle-kilometres driven above the new limit, Δv is the average speed reduction for those kilometres (km/h), β is the fuel saving per 10 km/h (5% to 10% for cars and about 5% for trucks, from the IEA), and c is the compliance rate.
Network fuel Fs is estimated in two ways as follows:
- Method A (National corridors length):
Corridor road length × average daily traffic (ADT) × vehicle mix gives vehicle-kilometres on each motorway and highway, which are converted to litres using fuel economy of 13 km per litre for LTVs and 3.5 km per litre for HTVs.
- Method B (National): National Road petrol and diesel use (10,475 million litres of petrol and 7,635 million litres of diesel in FY2025-26) × the share used by each vehicle class × the share burnt on motorways and national highways. Method B therefore rests on two sets of shares: the share of road petrol used by LTVs and of road diesel used by HTVs and PSVs (80% each), and the share of each burnt on motorways and national highways (petrol 14.6% and 21.1%; diesel 20.9% and 43.4%). The values used imply network volumes of 2,993 million litres of petrol and 3,928 million litres of diesel (Table 5), equal to 28.6 per cent of road petrol and 51.4 per cent of road diesel.