Executive Summary
Pakistan’s large shadow economy remains key challenge to tax collection, quality of governance, and slow economic growth. Formalizing financial inclusion offers a strategic and evidence based trail by increasing trustful dependence on official, transparent and traceable system to shrink the size of shadow economy. This knowledge brief highlights the development of financial inclusion from 2008 to 2025. It also defines the underlying causes of the shadow economy and financial inclusion and the empirical insights by financial services contribute to the transfer of economic activities into the formal economy. Pakistan’s still suffers from gaps across gender based exclusion, regional and income disparities despite a significant progress in branchless banking and digital payment platforms. Thus, cash remains a main medium of exchange leading to tax avoidance and informal economic activity. This brief suggest that reduction in shadow economy needs inclusive access and continuous usage of financial services for Pakistan’s citizens. Therefore, with organized reforms, financial inclusion is a powerful tool to reduce informality and it will support long-term sustainable development.
1. Introduction
Pakistan, the world‘s fifth most populous country and second populous in South Asia, still operating with a large shadow economy, basically the economy outside the official system. In 2024, a joint study conducted by the ILO and the SMEDA had estimated the shadow economy in Pakistan to be approximately 35-40% of the GDP, estimated at about US$457 billion. About 6% of the GDP is unreported annually. This weakens the inclusive growth and lowers government revenue. A significant number of traders do not register their business or workers and large number of workers remain unbanked. The high cash transactions enhances inequality and creates financial challenges for the country. Therefore, connecting individuals and businesses into documented economy through digital transactions, registered bank accounts and other complementary services can be efficient way handle these challenges. In that regard, better access to and use of financial services is important in reducing the shadow economy and contributing to sustainable economic growth in Pakistan.
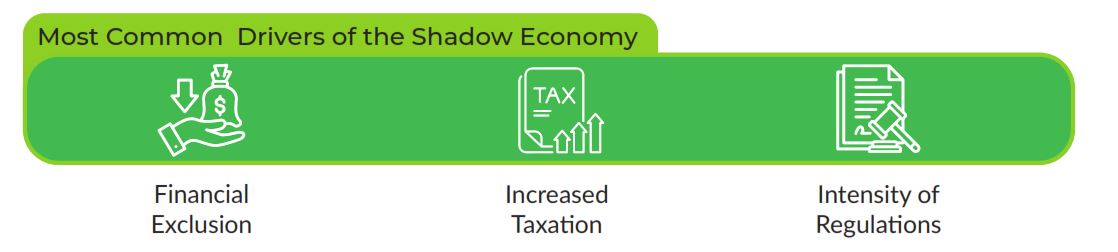
The shadow economy, broadly defined as the legally permissible economic activities intentionally hidden to evade taxation, social security contributions or regulatory oversights continues to represent a significant share of total economic output title relates to the same version of the shadow economy (Schneider & Enste, 2000). Every Recent empirical estimates highlighted strong presence of shadow economy and this is not just about numbers but structural issues and problems that restrict access to finance, increase economic and social exclusion, and highlight governance failure. As informality persists, it undermines fiscal transparency, reduces government revenue, and distorts market dynamics as many businesses and workers operate beyond the formal tax and regulatory system.
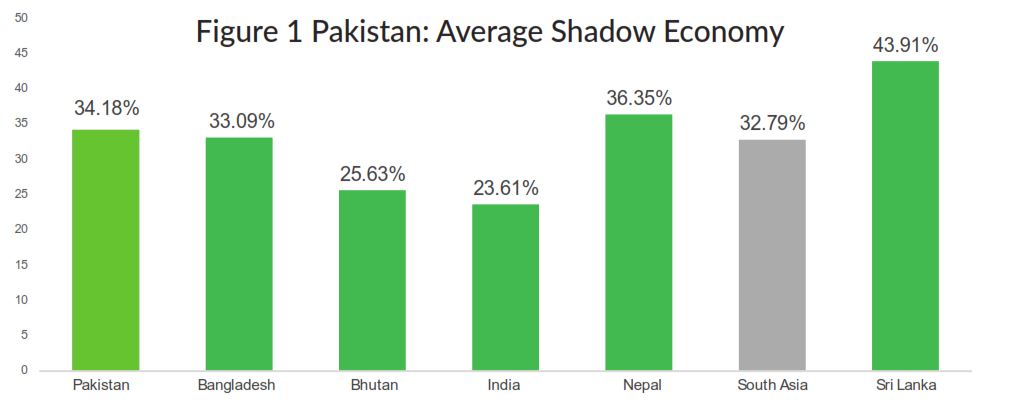
The stated graph shows average shadow economy in South Asian countries from 1990 to 2017 (Medina & Schneider, 2019), placing Pakistan’s slightly above the South Asia. Pakistan’s level is nearly similar to Bangladesh, which is higher than India, and lower than Nepal and Sri Lanka. These comparisons makes it clear that informality still remains a major regional challenge with Pakistan’s shadow economy is still higher than above regional benchmark. The findings reinforce the need for policies that strengthen financial inclusion and easing the shift of individuals and firms into the formal economy.
Source: Own calculations on the basis of (Medina & Schneider, 2019)
Complementary to this, figure 2 presents the size of the shadow economy as a share of GDP in South Asian countries from 1991 to 2017 using data from (Medina & Schneider, 2019), who estimate informality through the MIMIC method. Pakistan consistently maintains a large shadow economy around 30–37% of GDP with only a gradual decline over mid-2020s. Sri Lanka consistently records the highest informality for most of the period, while Nepal’s shadow economy was initially more than Pakistan, then converges to Pakistan’s level. India, Bangladesh, and Bhutan have comparatively smaller shadow economies. Overall, the graph indicates that Pakistan’s continues to exhibit large and enduring shadow economy persistently high relative to other countries in the region.
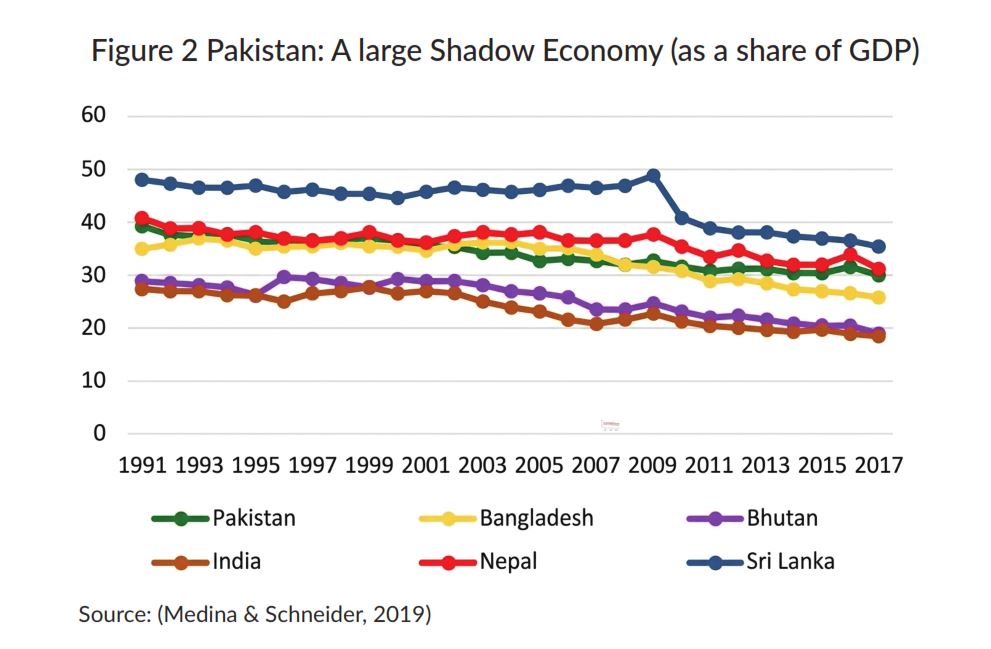
Table 1 Systematic Review: Estimated Shadow Economy Size – Historical Estimates
| Studies | Study Period | Theoretical Framework | Methodology / Method | Main Results / Conclusion |
| (M. Ahmed & Ahmed, 1995) | 1960–1990 | Modified Tanzi’s Monetary Approach including bearer bonds | OLS | Avg Shadow Economy: 41.79%. Overall Increase in Tax Evasion and SE, but decline in SE as percentage of GDP. |
| (Shabsigh, 1995) | 1975–1991 | Modified Tanzi’s Monetary Approach used to estimate SE as % of domestic, exports, and imports sectors | OLS | Avg Shadow Economy: 22.70% Overall rise in SE as percentage of GDP. It showed Short- and Long-run relationship between SE and Govt Budget Deficit. |
| (Aslam, 1998) | 1960–1968 | Modified Tanzi’s Monetary Approach including dummy for Resident Foreign Currency Accounts | OLS | Avg Shadow Economy: 39.33%. changes in policies and political scenarios shows high level of Shadow Economy vulnerable to fluctuations. |
| (Kemal, 2003) | 1974–2002 | Modified Tanzi’s Approach | OLS | Avg Shadow Economy: 31.82%. |
| (Kemal, 2007) | 1974–2005 | Modified Tanzi’s Approach | OLS and VAR | Avg Shadow Economy from 3 equations: 25.77, 49.54, and 36.37 %. Cointegration results found significant positive long run relationship between Official and Unofficial Economies. Similarly, VAR results exerts positive Short-run influence of SE on GDP but no significant effect of formal economy on SE. |
| (Q. M. Ahmed & Hussain, 2008) | 1960–2003 | Modified Tanzi’s Approach | OLS | Avg Shadow Economy: 25.22, and 30.51%. Tax reforms in 1997 showed reduced unofficial money demand. |
| Arby, Malik and Hanif (2010) | 1966–2008 | Modified Tanzi’s Approach | ARDL | Avg Shadow Economy: 29.68%. First, it rises with largest increase in 1990s and then gradually declines. |
| 1973–2008 | MIMIC Approach | Structural Equation Models | Avg Shadow Economy: 29.43 %. First, it increased sharply then stable between 20-30% during 1980s-2000s. | |
| 1975-2008 | Electricity Consumption | – | Avg Shadow Economy: 21.60%. | |
| (Gulzar et al., 2010) | 1982–2010 | Tanzi’s Approach | OLS | Avg Shadow Economy: 34.11%. It concluded with SE lies between 32-38% of GDP. |
| 1973–2010 | Modified Tanzi’s Approach | DOLS | Avg Shadow Economy: 23.84%. It concluded with SE lies between 20-22 % of GDP | |
| 1973–2010 | MIMIC | Structural Equation Models | Avg Shadow Economy: 29.93 %. It concluded with SE nearby 28 % of GDP | |
| (Kiani et al., 2015) | 1975–2 010 | Modified Tanzi’s Approach | ARDL | The estimated average shadow economy is 26.72%. |
| (Mughal et al., 2018) | 1973–2015 | Currency-demand (“monetary”) approach extended with unemployment & government control | ARDL model; Engle–Granger two-step; extended model with tax, unemployment, govt control | Across three models, the estimated Shadow economy averages are 26.41%, 25.29%, 26.11% of GDP. |
| (Manzoor et al., 2018) | 1998–2015 | Modified currency-demand approach | ARDL bounds test (dynamic monetary model) | Shadow economy weakened from 49.38% of GDP in 1998 to 27.16% in 2015. |
| Jabbar, A., Iqbal, J. (2021) | 2011–2021 | MIMIC (Multiple Indicators Multiple Causes) model | MIMIC latent-variable estimation | Average Shadow economy is around 26.64%, |
| (Habib et al., 2024) | 1980–2022 | Currency demand (monetary) approach | Regression analysis of currency demand (CD) | Shadow economy rises 11.17% (1980) to 44.14% (2022); long-term average 28.33%. Tax rose from 1.23% to 7.43%, averaging 4.49%. Simplified taxes, broader tax base, and improved financial inclusion are required. |
Financial inclusion refers to a system in which individuals, businesses can obtain access and use affordable, appropriate, and well-regulated financial services including payments, loans, savings, credit, investments, and insurance that meet their everyday needs. It is typically measured through indicators like account ownership, access to credit, branch/ATM availability, digital payment usage, supplemented by composite indices such as the World Bank Global Findex. Financial inclusion is achieved when individuals actively use regulated accounts including banks, mobile money provider and deposit taking microfinance institutions. Those who depends on informal saving methods, someone else’s account or limited service providers are categorized as financial exclusion.
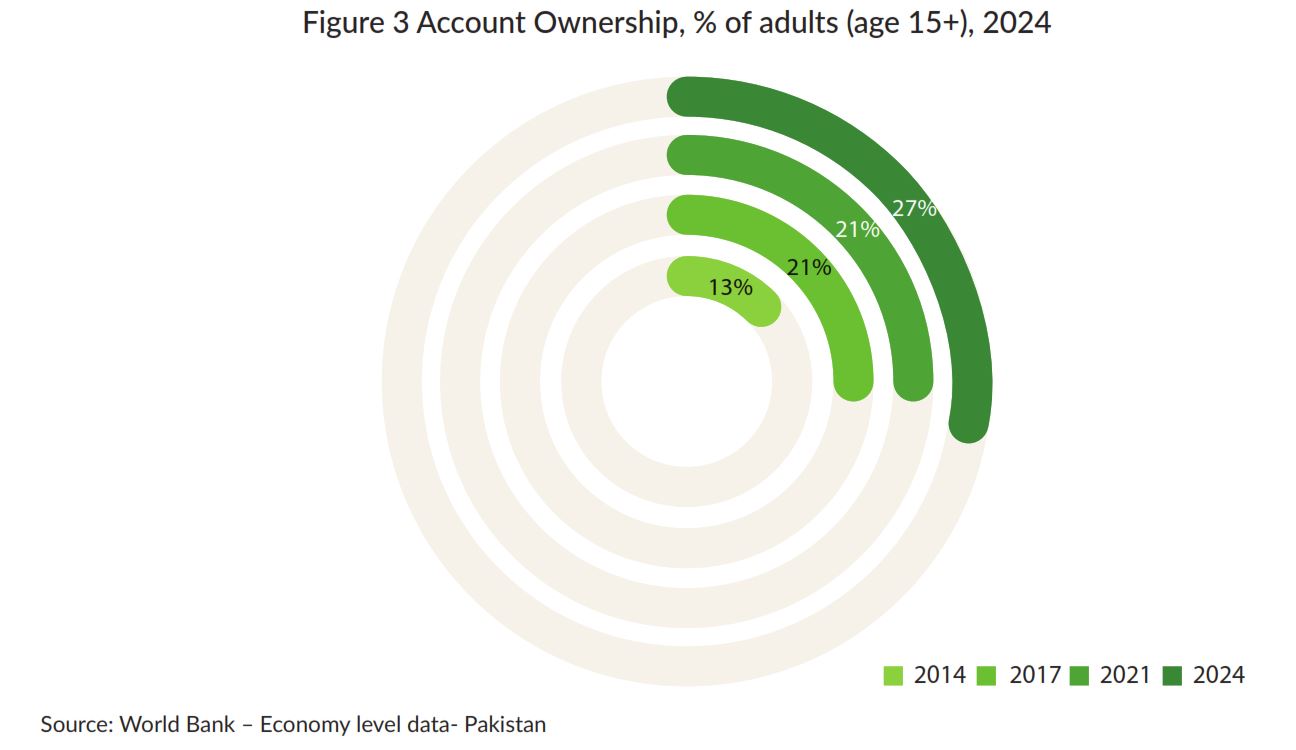
Adult account ownership in Pakistan has been increasing, which indicates that people have increased access to formal financial services. This is significant because low financial inclusion has historically fueled since people and small businesses are dependent on cash based transactions within the informal economy. Formalization, better transparency, and a reduction in tax evasion through the increased number of accounts can be promoted, which in the end will lead to a smaller shadow economy and financial sustainability. The figure 3 illustrates the progress of financial inclusion over the past decade and signifies its implications for the shadow economy as low account ownership indicates financial exclusion that drives cash-based transactions and fuels the shadow economy. Between 2014 and 2024, account ownership among adult (age 15+) in Pakistan increased from 13% to 27% reflecting gradual progress in financial inclusion (Karandaaz, 2024).
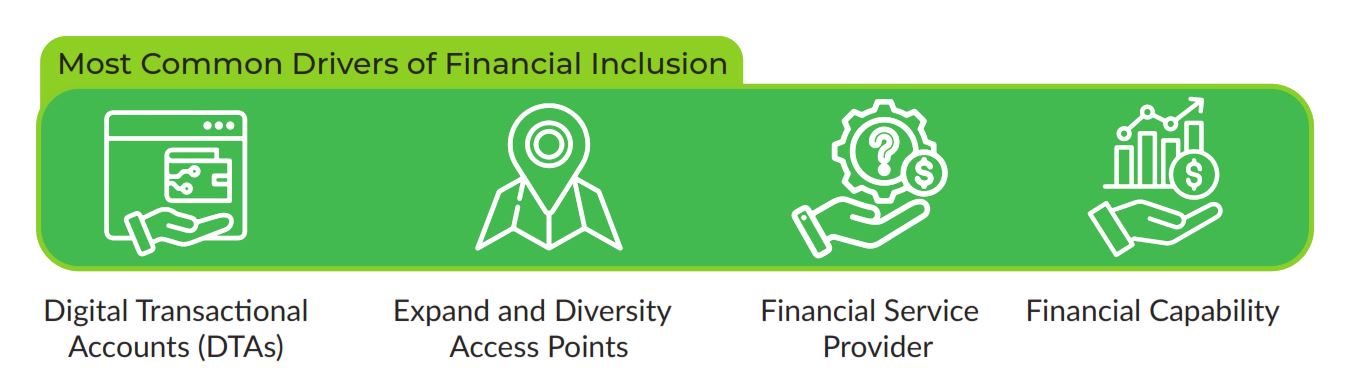
Current data shows a substantial gap in financial inclusion within the adult population. The total number of individuals aged 15 and above is around 155.83 million and 113.30 million of these adults do not hold a formal financial account, leaving more than two-thirds outside the formal financial framework (WB, 2024b). Similarly, significant gaps remain as in 2024; the bank registration data shows clear differences by location and gender. Urban bank registrations stood at 20%, slightly higher than the 16% bank registrations recorded in rural areas, reflecting a modest urban–rural gap. However, gender disparities on the other hand reveals a much sharper contrast: 56% males were registered against only 14% females (Karandaaz, 2024). Although geographic differences are relatively small, the data clearly suggests that women’s participation or access in 2024 remains far below than men. Thus strengthening formal financial services is therefore essential to reduce informality and improve governance. Promoting financial inclusion by improving access to accounts, digital tools, and affordable services can be an important policy tool for shrinking the size of shadow economy (Rojas Cama et al., 2024).