Pakistan’s industrial sector has long been positioned as the backbone of exports, employment, and structural transformation. Yet, despite its centrality, the sector has experienced persistent stagnation, declining competitiveness, and a shrinking share in GDP. This slowdown is not only cyclical but reflects deeper structural constraints, among which the energy sector stands out as a critical bottleneck.
Energy in Pakistan is not just costly; it is unreliable and highly volatile. These three significant extents: pricing, reliability, and volatility, interact to create a difficult operating environment for the industrial sector. Instead of supporting production and expansion, the energy system has increasingly become a constraint on growth, particularly for energy-intensive sectors.
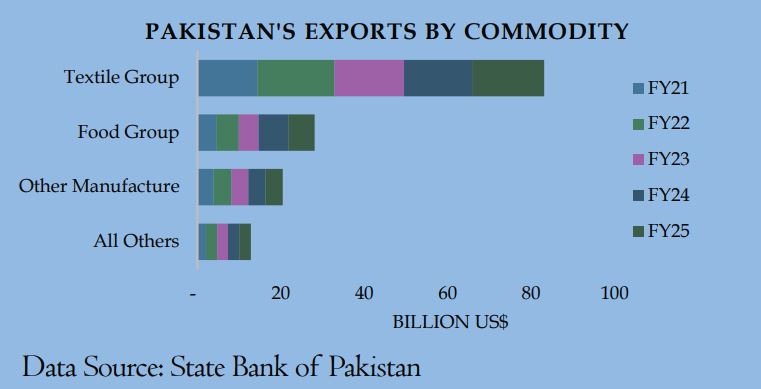
Pakistan’s export base remains highly concentrated, with textiles accounting for over 53% of total exports in FY25. Other sectors, such as cement, steel, and engineering goods, also depend heavily on continuous energy supply. This makes industrial performance highly sensitive to changes in electricity and gas prices, supply disruptions, and fluctuations in fuel costs.
Figure 1: Textiles’ Concentration in Pakistan’s Export Base
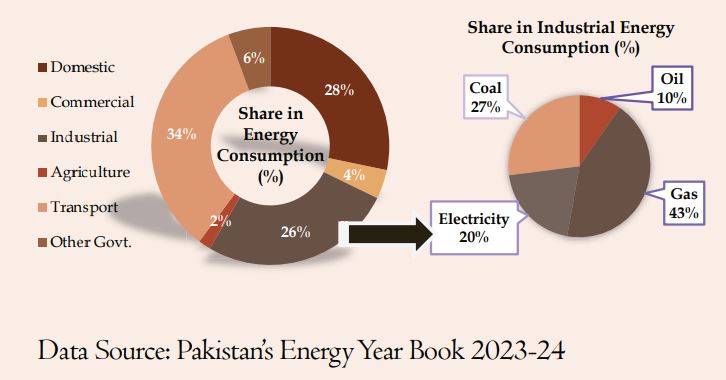
At the same time, the industrial sector consumes around 26% of total energy, with gas forming the largest share, followed by coal and electricity. This structure reflects a deep dependence on fuels that are both supply-constrained and price-volatile.
Figure 2: Sectoral Energy Consumption in Pakistan (FY24)
Energy Pricing: A Structural Cost Burden
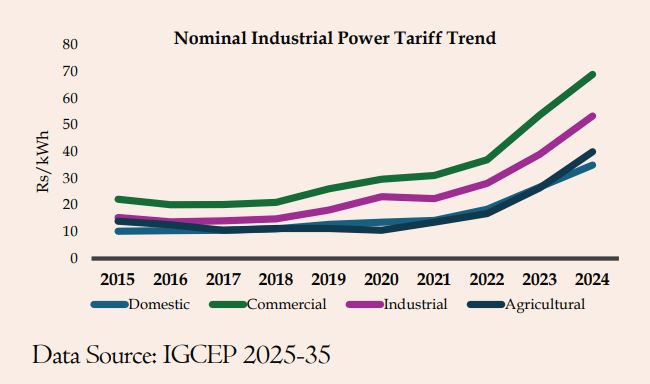
The most immediate constraint on industrial expansion in Pakistan is the high cost of energy. Industrial electricity tariffs have risen sharply over the past decade, increasing from Rs 15.39 per kWh in 2015 to over Rs 53.44 per kWh in 2024. This steep increase has significantly raised the cost of doing business and reduced industrial competitiveness. The tariff trajectory also shows that the sharpest increases occurred after 2019, when industrial power tariffs more than doubled within a few years. This reflects rising capacity payments, fuel cost adjustments, and fiscal pressures.
Figure 3: Electricity Tariff Trends Across Sectors
When compared to peer countries, Pakistan’s disadvantage becomes even more pronounced. Industrial electricity prices average around 15.5 US cents per kWh, placing Pakistan above key competitors such as India, Bangladesh, Indonesia and Vietnam, as shown in Figure 4. This gap directly affects export competitiveness and pricing power.
Figure 4: Industrial Electricity Tariffs: Country Comparison (2023-25 Avg.)
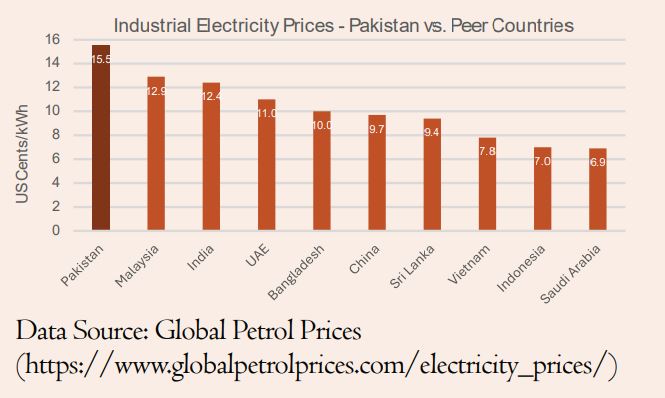
Data Source: Global Petrol Prices (https://www.globalpetrolprices.com/electricity_prices/)
The primary reason for high tariffs is cross-subsidization. Industrial consumers pay higher rates to offset subsidies for residential users, widening the cost burden on productive sectors. Recent tariff adjustments reflect a mixed but overall cost-escalating structure. The average variable tariff has increased from PKR 33.35/kWh in FY25 to 37.63/kWh in FY26 (irrespective of the PM Industrial Relief Package), marking a 13% rise across most industrial categories as shown in the table below. Since variable charges directly determine per-unit production costs, these increases have significantly raised manufacturing costs, particularly for export-oriented industries operating continuous production cycles. In contrast, fixed charges have declined sharply from PKR 1,250/kW/month to PKR 471/kW/month, a 62% reduction, offering some relief for SMEs with lower capacity utilization. However, fixed charges do not directly affect production costs, but high variable tariffs offset these gains and reinforce cost pressures on industrial output.
Table 1: Increase in Variable Charges (FY25 vs. FY26)
| Industrial Category | Variable Uniform Tariff
(Rs/kWh) |
Fixed Uniform Tariff
(Rs/kW/M) |
||
| FY 25 | FY 26* | FY 25 | FY 26 | |
| B1 less 5KW/25KW | 31.95 | 36.24 | – | – |
| B1 Peak | 37.89 | 42.18 | – | – |
| B1 Off Peak | 31.20 | 35.49 | – | – |
| B2 5-500KW | 31.88 | 36.17 | 1250 | 500 |
| B2-ToU Peak | 37.83 | 42.12 | – | 500 |
| B2 ToU Off Peak | 28.56 | 32.85 | 1250 | 500 |
| B3 ToU Peak up to 500KW | 37.83 | 42.12 | 1250 | 460 |
| B3 ToU Off Peak | 29.39 | 33.68 | 1250 | 460 |
| B4 ToU Peak all loads | 37.83 | 42.12 | – | 440 |
| B4 ToU Off Peak | 29.11 | 33.40 | 1250 | 440 |
| Average | 33.35 | 37.63 | 1250 | 471 |
Data Source: NEPRA Tariff Notification 2024-25[1] and 2025-26[2]
*Excluding B5 For All Loads (at 220 kV & above) – Peak & Off-Peak
Reliability: The Paradox of Excess Capacity
Pakistan’s power sector presents a paradox of excess capacity alongside unreliable supply. Despite installed capacity exceeding 40,000 MW, industries continue to face outages, voltage fluctuations, and transmission constraints. This reflects systemic inefficiencies rather than a shortage of generation. Demand trends further highlight this imbalance. While capacity has expanded, demand has stagnated and even declined in recent years due to high tariffs and weak industrial activity.
Power Generation trends reinforce this issue. After a period of growth until FY22, electricity generation has declined continuously, indicating weakening demand and reduced industrial consumption.
Unreliable supply imposes high costs on the industry. Production disruptions, machinery damage, and export delays reduce efficiency and increase operational risk. As a result, firms increasingly rely on captive power generation, which raises costs and reduces overall productivity.
Gas Sector: Declining Supply and Rising Costs
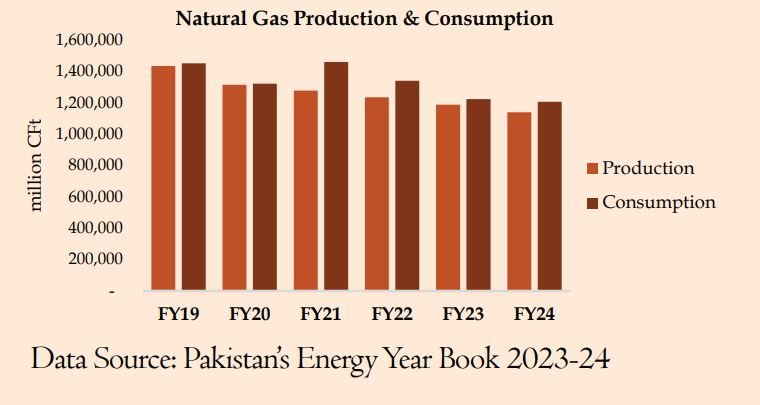
The gas sector presents another major constraint. Pakistan’s indigenous gas production has declined by around 21% between FY19 and FY24, while demand continues to exceed supply. This has widened the production-consumption gap and raised reliance on imported RLNG.
Figure 5: Natural Gas Production vs. Consumption Trend
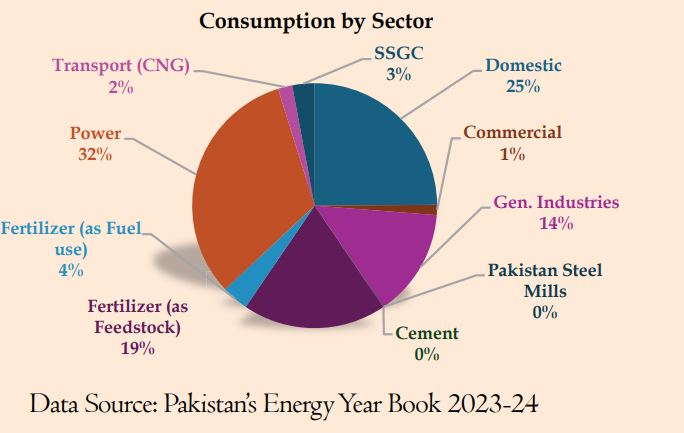
The sectoral distribution of gas consumption also reflects policy distortions. A large share is allocated to households and power generation, while industry receives a relatively smaller portion despite its economic importance.
Figure 6: Gas Consumption by Sector (FY24)
Gas pricing further compounds the problem. Industrial users pay significantly higher tariffs than domestic consumers, reflecting a cross-subsidy structure that increases production costs.
Table 2: Gas Tariff Structure – Domestic vs. Industrial (2025)
| Consumer Category | Tariff (PKR/MMBTU) |
Minimum Monthly Charge (PKR/month) |
| Domestic (Protected Category) | ||
| • Up to 0.25 hm³/month | 200 | Fixed: 600 + Meter rent: 40 |
| • Up to 0.5 hm³/month | 250 | Fixed: 600 + Meter rent: 40 |
| • Up to 0.6 hm³/month | 300 | Fixed: 600 + Meter rent: 40 |
| • Up to 0.9 hm³/month | 350 | Fixed: 600 + Meter rent: 40 |
| Domestic (Non-Protected Category) | ||
| • Up to 0.25 hm³/month | 500 | Fixed: 1,500 + Meter rent: 40 |
| • Up to 0.6 hm³/month | 850 | Fixed: 1,500 + Meter rent: 40 |
| • Up to 1.0 hm³/month | 1,250 | Fixed: 1,500 + Meter rent: 40 |
| • Up to 1.5 hm³/month | 1,450 | Fixed: 1,500 + Meter rent: 40 |
| • Up to 2.0 hm³/month | 1,900 | Fixed: 1,500 + Meter rent: 40 |
| • Up to 3.0 hm³/month | 3,300 | Fixed: 1,500 + Meter rent: 40 |
| • Up to 4.0 hm³/month | 3,800 | Fixed: 1,500 + Meter rent: 40 |
| • Above 4.0 hm³/month | 4,200 | Fixed: 1,500 + Meter rent: 40 |
| Industrial/ Captive Power (Bulk Meters) | 3,175 | 3,900 |
| General Industry (Process) | 2,300 | 35,540 |
| Captive Industry (Power Generation) | 3,500 | 36,653 |
| Cement Industry | 4,400 | 45,588.90 |
Data Source: SSGC[3]
Regional comparisons further show Pakistan’s disadvantage, particularly for captive power, where tariffs are significantly higher than those of competing economies.
Figure 7: Industrial Gas Tariffs – Pakistan vs. Regional Peers
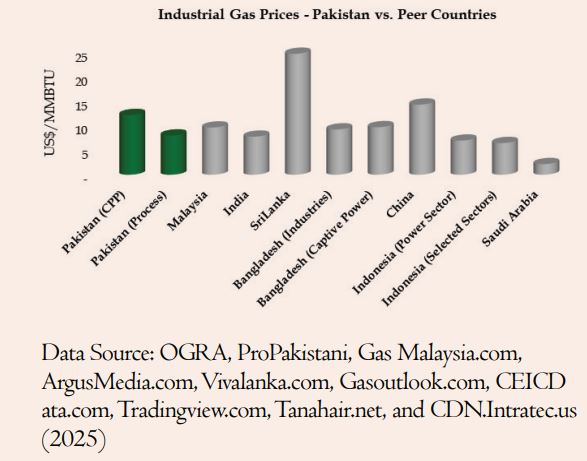
Data Source: OGRA, ProPakistani, Gas Malaysia.com, ArgusMedia.com, Vivalanka.com, Gasoutlook.com, CEICData.com, Tradingview.com, Tanahair.net, and CDN.Intratec.us (2025)
Volatility: The Unseen Barrier to Investment
Energy price volatility represents a critical but often overlooked constraint. Electricity tariffs in Pakistan are subject to frequent adjustments, including fuel cost adjustments and quarterly revisions. These changes create uncertainty for businesses and complicate financial planning. Gas prices, mainly RLNG, are linked to global markets, making them highly volatile. Sudden increases in global fuel prices translate directly into higher domestic costs.
This volatility discourages long-term investment. Industrial expansion requires predictable input costs, but in Pakistan, energy prices are uncertain and frequently change. As a result, firms are reluctant to invest in new capacity or upgrade existing operations.
Industrial Impact: Evidence from Consumption and Growth Trends
Pakistan’s industrial electricity consumption and large-scale manufacturing (LSM) growth exhibit a closely aligned pattern, underscoring the strong linkage between energy availability and industrial output. During the post-COVID recovery phase, industrial electricity demand expanded by 17% in FY21 and 4% in FY22, reaching 28,115 GWh in FY22. This period coincided with robust LSM growth of 4.4% in FY21 and a notable 10.6% in FY22, reflecting strong production activity across energy-intensive sectors such as textiles, cement and steel.
From FY23 onwards, both indicators reversed sharply. Industrial electricity consumption contracted by 8% in FY23, followed by a steeper decline of 12% in FY24 and a further 6% in FY25 (see figure below). This downward trend closely mirrors LSM’s performance, which declined by 7.0% in FY23, 0.2% in FY24, and 1.5% in FY25. The parallel movement of these indicators highlights how rising energy costs and supply constraints have directly translated into reduced industrial activity.
Figure 8: Industrial Electricity Consumption vs. LSM Growth
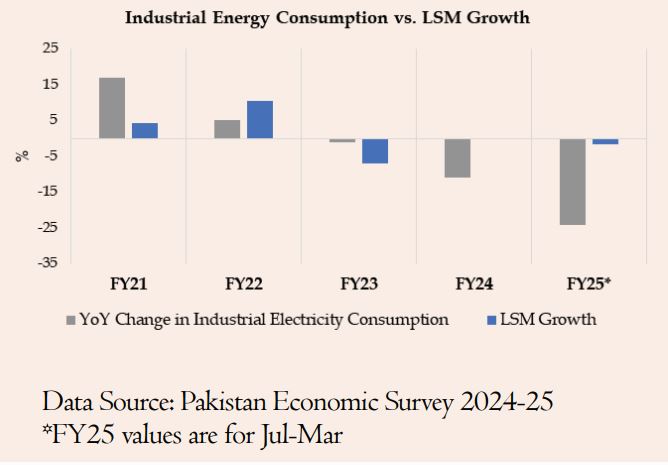
Data Source: Pakistan Economic Survey 2024-25
*FY25 values are for Jul-Mar
Key Finding: This correlation reinforces a critical insight: energy is not merely an input but a binding constraint on industrial performance. As electricity becomes more expensive and less reliable, production contracts, capacity utilization declines and overall industrial growth slows, with broader implications for exports, employment, and economic stability.
Policy Failures and Structural Constraints
The persistence of these challenges reflects deeper structural issues in Pakistan’s energy policy framework. Capacity payments continue to inflate tariffs, while inefficiencies in DISCOs are passed on to consumers. Subsidy structures also prioritize consumption over production, and reforms have progressed slowly.
Cross-Subsidization, circular debt, and weak governance have created a system that is both financially unsustainable and economically inefficient. Instead of supporting industrial growth, the energy sector has become a major constraint on it.
The Way Forward
Addressing these challenges requires a fundamental shift in energy policy toward industrial competitiveness.
Electricity tariffs, which have risen sharply over the past decade, must be aligned with regional benchmarks to restore cost efficiency, while untargeted cross-subsidies should be replaced with direct support for vulnerable households.
Expanding off-peak and seasonal tariff incentives can further reduce the cost burden on industry and encourage greater reliance on the grid over captive generation.
At the same time, structural inefficiencies in the power and gas sectors must be resolved. The burden of capacity payments, driven by excess installed capacity, continues to inflate tariffs and requires renegotiating contracts and improving demand management.
In the gas sector, declining domestic supply and reliance on costly RLNG have raised prices, while distorted allocation practices disadvantage the industry.
Scaling up renewable energy, improving system efficiency, and ensuring more predictable pricing will be essential to reducing volatility, restoring confidence, and supporting sustained industrial growth.
Namra Saleem is a Research Associate at Policy Research and Advisory Council (PRAC)
[1] NEPRA Notification. Available Link: https://nepra.org.pk/tariff/Tariff/Ex-WAPDA%20DISCOS/2024/TRF-100%20XWDISCOS%20and%20KE%20REVIEW%20MOTION%20CONSUMER%20END%20TARIFF%2011-07-2024%2010607-26.PDF
[2] NEPRA Notification. Available Link: https://www.nepra.org.pk/tariff/Tariff/Notifications/2025/07%20Jul/SRO%201287%20(I)%202025%2018-07-2025.pdf