
Synopsis. Pakistan has absorbed two major energy shocks in four years: the 2022 commodity and currency episode and the 2026 Strait of Hormuz disruption. Both moved through the same sequence: a fast rise in fuel and transport prices, a slower and more persistent rise in the general cost of living that concentrates in rural markets, and, arriving last, a change in the revenue base. This piece traces that sequence using publicly available price and collection data from both episodes and introduces a market-structure disaggregation of a decade of CPI sub-indices, which finds that the categories with the highest cumulative price growth were not the state-administered ones. It closes on what a reordered regional energy geography implies for the interval between shocks, a variable that matters more than shock depth alone for a transmission chain whose later stages run for quarters rather than weeks. The argument is not that any single instrument, supply diversification, levy design, or forecasting method, resolves this. It is that the chain has at least four distinct stages, each with its own actors and lag, and that framing it as a single event rather than a sequence makes its full economic cost difficult to anticipate.
Two shocks, one sequence
In February 2022, the invasion of Ukraine moved global energy and commodity prices sharply higher. In February 2026, the closure of the Strait of Hormuz following military operations involving Iran, the United States and Israel did the same. Four years apart, two shocks with unrelated triggers produced closely comparable domestic trajectories: a rapid and visible increase in fuel and transport prices; a slower, broader and more durable increase in the general cost of living; and, later still, a measurable movement in tax collection relative to target.
These are commonly reported as three separate stories. This piece treats them as four stages of one sequence, price shock, pass-through, persistence, and fiscal effect, and asks what publicly available data from both episodes can tell us about how long each stage takes and where within the economy it concentrates. The purpose is descriptive. Economic resilience against external energy shocks depends first on an accurate account of how those shocks actually travel, and the evidence suggests they travel further, and for longer, than the initial price movement alone would indicate.
Stage one: the initial pass-through is rapid
Energy price pass-through into Pakistan’s consumer price index is quick. In March 2026, the month following the Hormuz disruption, transport inflation moved from 0.4 per cent year-on-year to 12.5 per cent. By May 2026 it had reached 36.8 per cent, with housing and utilities inflation at 16.8 per cent. Year-on-year fuel price movements to mid-2026, as compiled by the Lahore School of Economics Modeling Lab, were diesel approximately 101 percent, petrol 48 to 54 percent, LPG approximately 66 percent, and natural gas 126 percent.
The 2022 episode moved at similar speed. Transport group inflation for July–April FY2022 stood at 19.4 per cent, against a decline of 1.3 per cent in the same period of the preceding year. Headline CPI rose from 9.50 per cent (2021) to 19.87 per cent (2022) to 30.77 per cent (2023), reaching a monthly year-on-year peak of 37.97 per cent in May 2023.
Figure 1: Two episodes of comparable magnitude: annual CPI in the 2021–23 shock, and year-on-year fuel price movements in the 2025–26 shock.
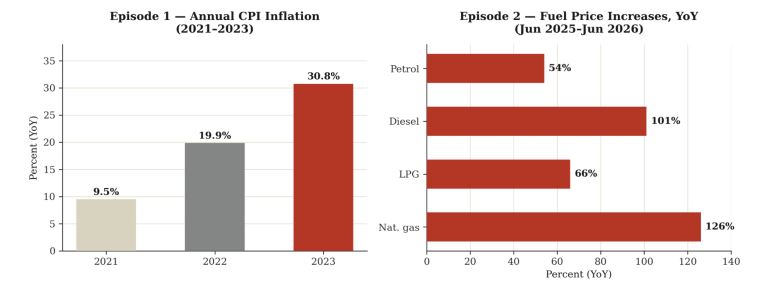
Source: Macrotrends/PBS annual CPI series; LSE Modelling Lab, FY2025-26 quarterly assessment.
Both episodes are consistent with the pattern described in the energy pricing literature as rockets and feathers: prices adjust rapidly and close to fully when input costs rise, and slowly and partially when they fall. The pattern is well-documented internationally across fuel and electricity markets. The question this raises for an economy like Pakistan’s is where in the price chain the asymmetry is largest, because the answer determines both how long the shock persists and which households carry it.
Stage two: the pass-through is not uniform across market types
One way to examine this is to disaggregate the CPI not by commodity group, which is the standard presentation, but by market structure, that is, by who sets the price. Applying this classification to sixteen urban CPI sub-indices over July 2015 to January 2025 produces three groups. Administered prices are those set or directly regulated by public authority: piped gas, electricity, motor fuel, wheat flour, and government education. Captured prices are those set in markets with concentrated supply or limited competitive discipline: cooking oil and vegetable ghee, drugs and medicines, doctors’ fees, house rent, and fresh milk. Competitive prices are those set in markets with many participants and low barriers to entry: cotton cloth, ready-made garments, communications, and transport services.
The cumulative price paths of the three groups over the decade separate clearly.
| Market type | Urban median, cumulative | Rural median, cumulative |
| Captured | +187% | +191% |
| Administered | +175% | +161% |
| Competitive | +126% | +157% |
| Headline CPI (reference) | +157% | — |
Source: Author’s classification and calculation.
Two observations follow. First, over the decade, the categories with the highest cumulative price growth in both urban and rural Pakistan were not the administered ones. Captured-market prices exceeded administered prices by twelve percentage points in urban areas and thirty percentage points in rural areas. Second, where competitive discipline is strongest, cumulative increases were substantially lower: communications, the most competitive sub-index in the basket, rose 43 per cent against a headline of 157 per cent, a large decline in real terms.
This matters directly for how an energy shock propagates. An increase in fuel costs enters the economy as an input cost for essentially every sector. Where it enters a competitive market, downward pressure eventually restores some of the price when the input cost falls back. Where it enters a market with concentrated supply or weak price transparency, that restoring mechanism is weaker, and the feather descends more slowly, or not at all. The decade-long data suggest a substantial share of Pakistan’s consumer basket sits in the second category, a structural characteristic of the markets themselves that operates independently of any movement in administered prices over the same period.
Stage three: persistence concentrates in rural markets
The 2022–23 episode indicates where an embedded price increase is slowest to unwind. At the May 2023 peak, national CPI inflation stood at 37.97 per cent year-on-year, but this masked a substantial gap: urban CPI rose 35.09 per cent while rural CPI rose 42.18 per cent. The same gap appears in food inflation a year earlier, at 15.6 per cent urban against 17.7 per cent rural in April 2022. It appears again in the market-structure data above, where the captured–administered gap is more than twice as wide in rural markets as in urban ones.
| Measure | Urban | Rural |
| CPI inflation, May 2023 (YoY) | 35.09% | 42.18% |
| Food inflation, April 2022 (YoY) | 15.6% | 17.7% |
| Captured-market median, cumulative to Jan 2025 | +187% | +191% |
Sources: PBS, CPI Press Release, May 2023; PES 2021-22, Chapter on Inflation; author’s calculation from PBS CPI sub-indices.
The structural features consistent with this pattern are well established: thinner competitive pressure among sellers, less real-time price transparency for buyers, greater reliance on transport-intensive distribution chains where fuel costs compound at each stage, and a higher share of cash transactions outside formal price monitoring. Once a price increase is absorbed into local pricing conventions in such a market, its reversal tracks the slower process by which those conventions reset, rather than the reversal of the original shock.
Core inflation data supports this from a second angle. In FY2022, core inflation, which excludes volatile food and energy prices, ran at 7.6 per cent urban and 8.3 per cent rural, well below headline CPI. That gap represents the second-round effect not yet fully arrived. The Pakistan Economic Survey’s account of the period attributes the subsequent rise in core inflation to “higher domestic demand, lagged impact of exchange rate depreciation”, describing persistence that arrives after, rather than alongside, the initial trigger.
Stage four: the movement in the revenue base, and its lag
The fourth stage is the one most directly relevant to fiscal planning, and its lag can be observed in published collection data from the current episode. For July 2025 to January 2026, that is, before the Hormuz disruption began on 28 February 2026, the Federal Board of Revenue’s cumulative shortfall against its in-year assigned target stood at Rs 372 billion. By May 2026, approximately three months after the disruption, the cumulative shortfall for the same fiscal year stood at Rs 683 billion.
Figure 2: The cumulative shortfall against in-year target widened by approximately Rs 311 billion between January and May 2026.
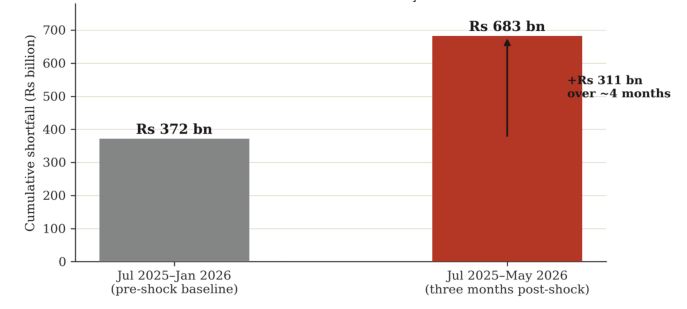
Source: FBR provisional collection data as reported by TechFinPost (February 2026) and The Express Tribune (May 2026). Figures are cumulative shortfalls against in-year targets, not annual totals.
This is an arithmetic difference between two published cumulative figures, not an attribution study. Several factors moved during this window, and the movement cannot be assigned to the Hormuz disruption alone from public data. What can be said is that the timing is consistent with the sequence described above: an energy price shock compresses real household purchasing power through the pass-through and persistence stages, and consumption-linked revenue heads respond to that compression with a lag, while import-linked heads respond to changes in import volume and value on a different and generally shorter timeline.
The 2022–23 episode shows the same lag structure over a longer horizon. Revenue performance in FY2023 was affected by import compression and by the composition of the consumption base during a high-inflation year; sales tax collection underperformed relative to target across the first eleven months even though the general sales tax rate had moved from 17 to 18 per cent in the same period, an illustration of the general point that a rate change and a base change can move in opposite directions simultaneously. The following year, collection grew 29.8 per cent to Rs 9,299 billion, a figure carrying an important caveat for anyone reading it as a recovery signal.
This last point is worth stating precisely, because it applies to both episodes and to any future one. Inflation raises the nominal value of transactions on which ad valorem taxes are levied, supporting nominal collection, while simultaneously compressing real purchasing power and reducing the volume of taxed transactions (an ad valorem tax is charged as a percentage of a transaction’s value, so its yield rises automatically with price; a specific-rate tax is charged as a fixed amount per unit, litre or item, so its yield depends on volume rather than price. If petrol is taxed at 18 per cent of value, a rise in the pump price from Rs 250 to Rs 350 per litre lifts the tax take from Rs 45 to Rs 63 on the same litre. A levy fixed at Rs 60 per liter yields Rs 60 at either price, and moves only when the number of liters sold changes). These effects run in opposite directions and resolve at different speeds. Which dominates in a given quarter depends on the composition of the consumption basket, the share of ad valorem versus specific-rate instruments in the revenue mix, and how far through the persistence stage the economy has travelled. It is not knowable from the size of the initial price shock alone.
What the sequence implies for resilience
Economic resilience against energy shocks is most often framed as a supply-side question: diversifying import sources, expanding domestic generation, building storage. These are substantial and well documented. The sequence traced here points to a complementary dimension: the analytical capacity to anticipate how a shock travels once it has arrived.
Three observations follow from the data above, none requiring a claim about which instrument matters most. First, the four stages operate on different timescales, pass-through in weeks, persistence over quarters to years, and fiscal effects with a lag that the 2022–23 episode suggests can extend across more than one fiscal year. A framework treating an energy shock as a single-period event will not capture its full footprint, because most of that footprint arrives after the initial price movement has been reported. Second, where a shock lands matters as much as how large it is: the same input cost increase behaves very differently entering a competitive market than a concentrated one. Third, because rural markets absorb and retain price increases differently from urban ones, national aggregates understate both the depth and duration of the effect for a large share of the population.
The four-stage structure has a direct implication for what a statistical apparatus tracks and how those series are read together. At present the relevant data sit in three places and are published on three separate cycles: the Pakistan Bureau of Statistics produces the CPI and SPI, disaggregated by urban and rural strata and by sub-index; the State Bank produces the core inflation series and the monetary policy assessment; and the Federal Board of Revenue produces monthly collection against target. Each is sound in isolation. What no published series currently does is align them on a common event clock, so that the interval between a fuel price movement and its appearance in rural sub-indices, and then in consumption-linked collection heads, can be observed directly rather than inferred after the fact. A joint indicator, published quarterly, that tracks an energy price index alongside urban and rural CPI sub-indices, grouped by market structure, and collection performance in the revenue heads most exposed to consumption compression would make the lag structure visible while it is running rather than in retrospect. The component data already exist and are already published. What is absent is the convention of reading them as one series.
There is a broader question underneath this, which the post-growth literature has recently returned to the mainstream of development economics. Kallis and co-authors[1], writing in The Lancet Planetary Health in 2025, argue that the indicators an economy organizes itself around shape what that economy can notice. The point applies directly here. Pakistan’s real GDP per capita grew by roughly 59[2] percent from 2000 to 2025. Over a broadly comparable period, the prevalence of stunting among children under 5 moved from 41.6[3] percent in 2000 to 40.2[4] percent in 2018. A framework that tracks aggregate output closely and distributional outcomes loosely will register an energy shock as a growth and inflation event, and register its persistence in rural consumption baskets, where the market-structure data suggests it lasts longest, considerably later, if at all.
This is not an argument for any particular reform. It is an argument that the first requirement for resilience is an accurate map of the terrain a shock crosses. The four stages described here are each measurable with data that is already published. Whether they are measured together, as one sequence, is a choice about what a fiscal and statistical apparatus is built to see.
That choice is now more consequential, because the frequency of the trigger has changed. The chain traced here is activated by an external price movement, and Pakistan’s exposure to such movements is a function of two regional variables: the share of energy that is imported, and the concentration of the routes through which it arrives. Both are determined by the structure of regional energy relationships rather than by domestic policy alone. A regional order in which Gulf supply routes are subject to periodic interruption does not simply raise the cost of a given shock, it shortens the interval between shocks, which matters considerably for a chain whose later stages run for quarters rather than weeks. Where the persistence stage of one episode overlaps the pass-through stage of the next, the price level does not return to its pre-shock path between them. Connectivity and diversification are usually discussed as measures reducing the depth of an energy shock. The sequence described here suggests they also govern how much time an economy is given to complete its adjustment before the next one arrives.
A note on method and sources
This piece draws on publicly available data: Pakistan Bureau of Statistics CPI press releases and monthly sub-indices, the Pakistan Economic Survey, the National Nutrition Survey 2018, World Bank World Development Indicators (NY.GDP.PCAP.KD), FBR Revenue Division Yearbooks, contemporaneous reporting of FBR provisional collection figures, and the Lahore School of Economics Modeling Lab FY2025-26 quarterly assessment. Three caveats apply. The classification of CPI sub-indices into administered, captured, and competitive groups is the author’s own and reflects a judgment about market structure rather than any official designation; readers may reasonably classify individual sub-indices differently. The Rs 311 billion figure in Figure 2 is the difference between two published cumulative totals and indicates timing and magnitude, not causal attribution. The fuel price movements cited for 2025-26 are drawn from a single institutional source and presented as that source’s compilation.
Zehra Farooq is a Special Assistant to Member, Strategic Transformation / Federal Board of Revenue, Government of Pakistan
[1] Kallis, G., Hickel, J., O’Neill, D.W., Jackson, T., Victor, P.A., Raworth, K., Schor, J.B., Steinberger, J.K., & Ürge-Vorsatz, D. (2025). “Post-growth: the science of wellbeing within planetary boundaries.” The Lancet Planetary Health, 9(1), e62–e78. DOI: 10.1016/S2542-5196(24)00310-3
[2] https://data.worldbank.org/indicator/NY.GDP.PCAP.KD?locations=PK
[3] https://data.worldbank.org/indicator/SH.STA.STNT.ZS?locations=PK
[4] https://jpma.org.pk/index.php/public_html/article/view/20380