
Key Insights
At 6.5 days, Pakistan’s average export dwell time ranks 9th of 10 regional peers; slower than every comparator except Turkiye (World Bank LPI 2.0, 2026).
Our estimations based on general equilibrium simulation shows that cutting dwell time by just one day could raise Pakistani exports by US$624 million a year, simultaneously rising to US$1.9 billion for a three-day cut.
Single-window customs integration, risk-based inspection, and cross-border data exchange have each delivered multi-day reductions in comparable economies.
1. Introduction
Pakistan’s export policy continues to rely mainly on fiscal instruments to support competitiveness, including concessional credit, energy subsidies, and tax relief. The recent FY2026-27 budget follows this pattern as well, with increased credit facilities for the textile sector, extension of partial electricity subsidies for export zones, and a renewed commitment by the Federal Board of Revenue towards digitalization among its main export-related measures (FBR, 2026). While these instruments are definitely needed, they address only one side of the competitiveness equation. Apart from Energy, finance, and tax costs, a huge and under-addressed component of Pakistan’s export competitiveness remains in the form of port delays, which constitute a distinct, and often larger impact than the costs fiscal policy typically targets. A major share of these delays corresponds to the time a container spends at the port awaiting customs clearance and inspection before it can be loaded onto the vessel, which has constrained Pakistani exporters for years.
This idle time translates to a hidden tax on exporters, often much larger than the applied tariff rates, as evidenced by the empirical literature. Hummels and Schaur (2013) have demonstrated that each additional transit day equates to about 0.6-2.1 percent increase in ad valorem tariff. Djankov, Freund and Pham (2010) have further supplemented this by using factory-gate-to-ship data across 98 countries, demonstrating that each additional day of per-shipment delay results in trade reduction by more than 1%, constituting disproportionate effects on perishable goods.
Furthermore, on the aggregate level, utilizing panel Poisson Pseudo-Maximum Likelihood (PPML) estimations, on a data derived from 1995-2016, Heid, Larch and Yotov (2021) provide that, with bilateral fixed effects, each additional transit day reduces the bilateral exports by 3.6 percent. Moreover, Noureen and Mahmood (2022), reinforce the same idea, using a system GMM gravity model, concluding that non-tariff barriers, which also include time uncertainties, are the dominant driver of persistently high trade costs, especially in case of emerging economies.
On the other hand, for policy perspective, Masood and Martínez-Zarzoso (2024) find, that within a structural gravity framework that incorporates intra-national trade, that trade facilitation effects are heterogeneous and systematically larger for non-OECD exporters, directly amplifying the expected returns to reform in Pakistan’s context. At the firm level, Volpe Martincus, Carballo and Graziano (2015) show that customs delays harm sales to newer buyers most severely, undermining market diversification. Shepherd (2013) further documents that shorter clearance times shift firms from indirect to direct exporting, improving margins and market control. Collectively, this literature confirms that port logistics reform of the kind proposed here represents among the highest-return trade policy interventions available to a developing economy.
Yet Pakistan’s share of global merchandise trade has long remained stagnant despite a large and diversified manufacturing base, most notably in textiles, which account for nearly 60 percent of national exports (ITC, 2025), precisely because fiscal measures of the kind described above are undercut by the time costs at the port. A textile exporter in Faisalabad cannot use a tax credit to make up for a shipment that misses its buyer’s seasonal window, nor does an electricity subsidy matter if the container is still sitting on a dock. The returns to FY2026-27’s fiscal measures would be substantially larger if the logistics environment underlying them is also improved. Understanding the magnitude of these time costs, and the gains achievable through administrative and procedural reform, is therefore essential to designing evidence-based trade policy. This brief uses newly released World Bank LPI 2.0 data (April 2026) and a calibrated general equilibrium gravity model to quantify the export gains Pakistan could realize by reducing export container dwell time, which has been realized as one of the most actionable and well-measured logistics indicators, and to identify the reforms most likely to deliver that reduction.
2. Pakistan’s Logistics Performance
The World Bank Logistics Performance Index 2.0 (LPI 2.0), released in April 2026, is the most comprehensive cross-country dataset on trade logistics performance, and provides objective, time-based indicators derived from actual shipment data. It covers over 180 countries and measures logistics performance across nine dimensions, from container dwell times at ports of export and import, to lead times along supply chains, to postal delivery speeds.
The following table summarizes Pakistan’s performance across all nine time-based LPI 2.0 indicators for 2024, reporting mean values in days alongside Pakistan’s rank among all countries and among ten regional peers (China, India, Indonesia, Malaysia, Philippines, Sri Lanka, Thailand, Türkiye, and Vietnam).
Table 1: Pakistan: Time-Based Logistics Indicators, LPI 2.0 (2024)
| Indicator | Pakistan (days) | Global Rank | Peer Rank |
| Aviation import dwell time | 4.9 | 106 / 121 | 10 / 10 |
| Container import dwell time | 9.3 | 122 / 163 | 10 / 10 |
| Container export dwell time | 6.5 | 72 / 155 | 9 / 10 |
| Turnaround time at ports | 1.3 | 91 / 166 | 7 / 10 |
| Lead time to import | 39.5 | 87 / 163 | 7 / 10 |
| Business-to-business postal delivery time | 9.3 | 116 / 187 | 7 / 10 |
| Business-to-consumer postal delivery time | 8.3 | 91 / 188 | 7 / 10 |
| Import supply chain termination | 3.0 | 74 / 163 | 9 / 10 |
| Export supply chain initiation | 2.8 | 48 / 154 | 7 / 10 |
Notes. Source: World Bank LPI 2.0 (2024 round). Mean values in days. Lower is better. Global ranks exclude regional and income-group aggregates; peer group comprises China, India, Indonesia, Malaysia, Philippines, Sri Lanka, Thailand, Türkiye, and Vietnam. Green = top third globally / top 3 among peers; amber = middle; red = bottom third / ranks 8-10.
The following figure plots export container dwell time (x-axis) against import container dwell time (y-axis) for countries in the LPI 2.0 dataset. Pakistan (orange diamond) sits above and to the right of most peers, indicating longer dwell times on both dimensions. The dotted diagonal marks equal export and import dwell time.
Figure 1: Export vs. Import Container Dwell Time: Pakistan and Peers (2024)
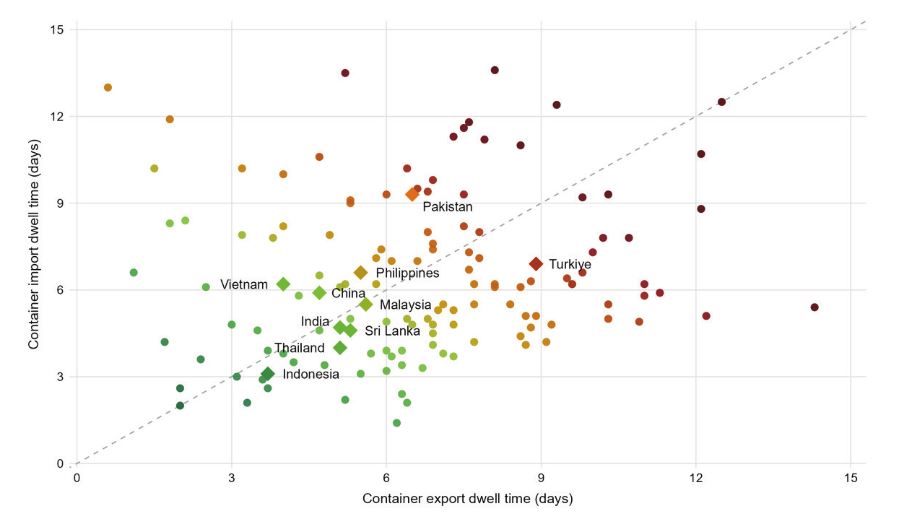
Source: World Bank Logistics Performance Index 2.0 (LPI 2.0), 2024. Mean values in days.
Chart axes capped at 15 days; The dotted diagonal marks equal export and import dwell time
The LPI data, as presented above, position Pakistan as a mid-to-low performer on most pf the logistics’ dimensions, with particular weaknesses in container dwell times , with sea import dwell time ranked at 122nd globally, and aviation import dwell time ranked at 106th, though showing relative strengths in export supply chain initiation (ranked 48th). However, the most policy-actionable indicator, export container dwell time places Pakistan 72nd globally and 9th among the 10 comparable regional economies. A growing body of empirical literature links LPI-type indicators directly to trade outcomes. Using a panel data and bilateral fixed effects with PPML estimations, Heid, Larch & Yotov (2021), found that each additional day of transit time resulted in reducing bilateral exports by approximately 3.6 percent. This elasticity estimate served as the core parameter in our simulation.
Analyzing the reasons behind Pakistan’s container dwell time being consistently elevated as compared to regional peers, the evidence points to process rather than infrastructure as the binding constraint. Nasir (2026), analyzing over 330,000 customs declarations at Karachi port, finds that supporting documents were called for additional scrutiny in 79 percent of cases where the underlying goods declaration required no further verification, providing evidence that discretionary, document-based processing, rather than risk-based targeting, drives much of the delay. Moreover, another research study on Pakistan’s seaports similarly documented a clearance sludge of overlapping requirements, where customs assessment, valuation, and separate anti-narcotics inspection, resulted in compounding waiting time even in cases where the individual agencies have digitalized their own procedures (Jaffry, 2021). These analyses also help to explain why the earlier national level digitalization efforts, including the Pakistan Single Window and WeBOC, although have improved transparency, but have still been inefficient in reducing the container dwell time. Thus, imposing that automation within a single agency cannot resolve delays arising from the duplication and sequencing of checks across agencies.
3. Simulation Results
We simulate the effect of reducing Pakistan’s export container dwell time by one to three days using the general equilibrium gravity framework (Campos, Reggio & Timini, 2024; Allen et al., 2020). The shock is applied exclusively to Pakistan’s bilateral exports. All other trade flows, including domestic trade, are held at their baseline trade values sourced from international trade and production data (ITPD[1]) (Larch, Shikher and Yotov ,2025). Results are reported in real export growth (percent), nominal dollar gain (USD millions), and household welfare change. The model is calibrated on the ITPD 2017–2019 trade baseline, consistent with the ge_gravity2 methodology’s data requirements; the resulting percentage export-growth estimates are then applied to Pakistan’s most recent trade values (ITC, 2025) to express the gains in current dollar terms.
Table 2: Simulated Export Gains from Dwell Time Reduction
| Scenario | New Dwell Time | Real Export Growth | Illustrative Additional Exports (USD M) | Welfare Gain |
| −1 day | 5.5 days | +2.03% | +$624M | +0.028% |
| −2 day | 4.5 days | +4.09% | +$1.26B | +0.056% |
| −3 days | 3.5 days | +6.18% | +$1.9B | +0.086% |
Notes. Baseline: Pakistan mean export container dwell time = 6.5 days (LPI 2.0, 2024). Baseline exports: USD 30.67 Billion (ITC, 2025). Real export growth from GE model; dollar gain = real growth × baseline. Welfare gain is taken as equivalent variation to share of income.
The analysis above demonstrates that a one-day reduction in export container dwell time yields USD 624 million in additional exports, which is comparable in magnitude to Pakistan’s entire annual export earnings from a single sector (i.e. chemicals). Similarly, a two-day reduction would add USD 1.26 billion to the export earnings, exceeding Pakistan’s total current exports to France. Figure 2 shows the distribution of these gains across major destinations and sectors for the one-day scenario. Extending the reduction further raises the gain: a two-day cut corresponds to a single year’s export gain of roughly US$1,255 million. Assuming 2 percent annual export growth thereafter, this annual boost would rise from $1,255M in year one to $1,359M by year five, for a cumulative gain of approximately $6.5 billion over the five-year period.
Figure 2: Additional Exports Under Scenario of Reducing 1 Day Export Container Dwell Time
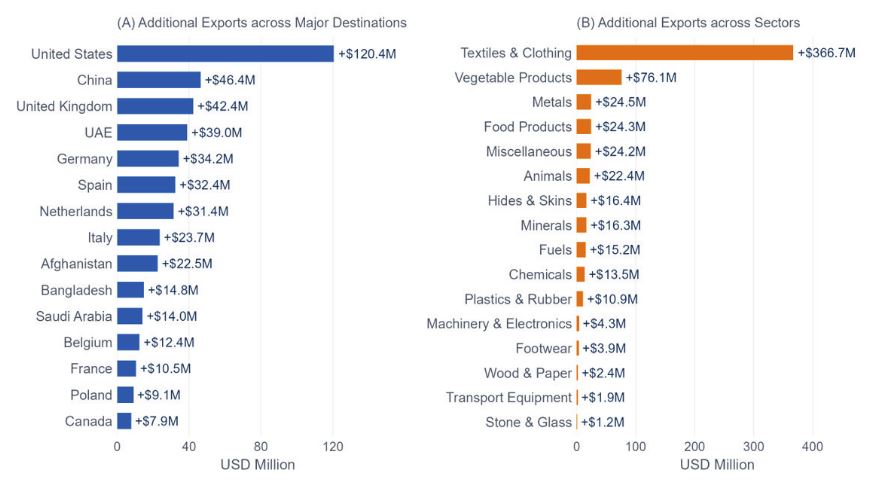
Note: Authors’ graphic based on data from ITC/Comtrade, 2025.
4. Conclusion & Policy Recommendations
Reducing the dwell time of export containers could be one of the highest-return trade policy measures currently available to Pakistan. Because the diagnostic evidence above points to discretionary, document-based processing and overlapping agency mandates rather than a lack of infrastructure or technology as the binding constraint. The general equilibrium estimates and regional experience reviewed here point toward four specific, evidence-linked policy recommendations.
- Prioritize single-window customs integration. Fragmented documentation requirements across agencies including port authorities, customs, and other regulatory/certification bodies are consistent with the discretionary, document-heavy processing identified above as the primary driver of Pakistan’s container dwell time. In this regard, Malaysia’s experience can present a compelling template for consolidating these requirements. In February 2025, Malaysia officially launched the Malaysia Maritime Single Window (MMSW) at Port Klang, its largest port on the Strait of Malacca, which handles approximately 11,000 vessel calls each year (Ovcina Mandra, 2025). The MMSW reduced vessel processing time, replacing manual and time-consuming procedures with a digitalized platform, from up to five days to within hours, supporting the port’s target of 15 million TEUs in 2025. Pakistan’s own Single Window (PSW) has made progress but, consistent with the diagnostic evidence above, has not yet fully consolidated all trade processes across agencies. Expanding PSW to integrate all regulatory agency requirements could realistically cut 1–2 days off average dwell time within 12–18 months.
- Invest in pre-clearance and risk-based inspection. Moving from document-based to risk-profiled inspection and targeting the share of shipments actually flagged as high-risk, rather than calling documents for the large share of routine declarations is the single most effective customs reform for reducing dwell time in comparable emerging markets. On this point, Vietnam’s recent implementation of a centralized electronic clearance system offers a model worth replicating. The system allowed them to reduce their container clearance time from multiple days to 1–2 days for international vessels. As a result, Ha Tinh seaport handled over 24 million tons of cargo in the first eight months of 2025, which was a 9 percent increase over the same period in 2024 (Báo Hà Tĩnh, 2025). Pakistan’s CTS and e-Bilty rollout (Dawn.com, 2026), financed by the World Bank, provides the foundation; completing this and expanding AI-based risk profiling to cover all consignments could realistically help cut 1–2 days off dwell time within 12 months.
- Information exchange with trading partners & procedural simplification: Pakistan’s digitalization of its customs regime should also include robust efforts towards including information exchange with trading partners, and procedural simplification following the proven template of regional peers. Uzbekistan’s digital transformation offers a compelling precedent, where reducing the export procedures from nine to three stages by establishing information exchange with nearly ten countries, and introducing AI-based risk analysis, the country was able to cut export clearance to 20 minutes and import clearance to 3 hours. According to the Uzbek authorities, these integrations helped the country’s budget revenues to increase by ninefold, vehicles crossing the border increased eightfold, and the country’s logistics ranking jumped from 140th to 74th globally. Pakistan’s existing data integration agreement with Uzbekistan provides a foundation; expanding such agreements to all major partners and completing AI-based risk profiling could yield similar gains, and reduce the country’s dwell time more effectively.
- Benchmarking & Continuous Monitoring. Pakistan should adopt the World Bank LPI 2.0 indicators as formal government performance targets for the Ministry of Commerce and the Federal Board of Revenue, with quarterly reporting and public disclosure. The current 6.5-day mean export dwell time should be the starting point, with a five-year target of 3 days, so that the country is consistent with regional median performance.
5. References
Aazim, M. (2025, June 30). Is the textile sector recovering? Dawn. https://www.dawn.com/news/1921167
Allen, T., Arkolakis, C., & Takahashi, Y. (2020). Universal gravity. Journal of Political Economy, 128(2), 393–433.
Báo Hà Tĩnh. (2025, September 26). Simplifying administrative procedures helps accelerate the development of Ha Tinh seaports. Vietnam.vn. https://www.vietnam.vn/en/don-gian-thu-tuc-hanh-chinh-giup-cang-bien-ha-tinh-tang-toc-phat-trien
Borchert, I., Larch, M., Shikher, S., & Yotov, Y. (2022). The International Trade and Production Database for Estimation (ITPD-E). International Economics, 169, 1–20.
Campos, R., Reggio, I., & Timini, J. (2024). ge_gravity2: A Stata package for GE gravity estimation. Bank of Spain Working Paper.
Dawn.com. (2026, March 6). Pakistan moves to digital cargo tracking. Dawn. https://www.dawn.com/news/1978938
Djankov, S., Freund, C., & Pham, C. S. (2010). Trading on time. Review of Economics and Statistics, 92(1), 166–173. https://doi.org/10.1162/rest.2009.11498
Embassy of the Republic of Uzbekistan in the Republic of Türkiye. (n.d.). Digital transformation in Uzbekistan [News release]. https://uzembassy.org.tr/news/6545?language=en
Government of Pakistan, Federal Board of Revenue. (2026). Finance Bill 2026–27.
Head, K., & Mayer, T. (2014). Gravity equations: Workhorse, toolkit, and cookbook. Handbook of International Economics, Vol. 4. Elsevier.
Heid, B., Larch, M., & Yotov, Y. V. (2021). Estimating the effects of non-discriminatory trade policies within structural gravity models. Canadian Journal of Economics, 54(1), 376–409.
Hummels, D., & Schaur, G. (2013). Time as a trade barrier. American Economic Review, 103(7), 2935–2959.
International Trade Centre. Trade Map [2025]. Retrieved from trademap.org
Jaffry, S. R. (2021). Maritime trade facilitation at seaports in Pakistan (MPhil thesis). Pakistan Institute of Development Economics (PIDE).
Larch, M., Shikher, S., and Yotov, Y. (2025), “The International Trade and Production Database for Estimation – Release 3 (ITPD-E-R03),” USITC Working Paper 2025–06–A.
Masood, A., & Martínez-Zarzoso, I. (2024). Trade effects of trade facilitation revisited. Economics Letters, 234, 111477. https://doi.org/10.1016/j.econlet.2023.111477
Nasir, J. (2026). Bureaucratic discretion and customs delays: Causal evidence from Pakistan. SSRN Working Paper.
National Assembly of Pakistan. (2025). [Committee report/bill documentation] (p. 53) [PDF]. https://www.na.gov.pk/uploads/documents/685aaa3aa27e2_462.pdf
Noureen, S., & Mahmood, Z. (2022). The effects of trade cost components and uncertainty of time delay on bilateral export growth. Heliyon, 8(1), e08779.
Ovcina Mandra, J. (2025, February 26). Malaysia launches Maritime Single Window. WorldCargo News. https://www.worldcargonews.com/ict-automation/2025/02/malaysia-launches-maritime-single-window/
Shepherd, B. (2013). Trade times, importing and exporting: firm-level evidence. Applied Economics Letters, 20(9), 879–883. https://doi.org/10.1080/13504851.2012.756574
Volpe Martincus, C., Carballo, J., & Graziano, A. (2015). Customs. Journal of International Economics, 96(1), 119–137.
World Bank. (2026). Logistics Performance Index 2.0. Washington, DC: World Bank Group.
6. Annex
Method Notes
| Model | ge_gravity2 (Campos, Reggio & Timini, 2024), implements the universal GE gravity framework of Allen et al. (2020). |
| Trade elasticity (θ) | 5.03: Head & Mayer (2014), meta-analysis of 2,508 estimates. |
| Supply elasticity (ψ) | 1.24: Campos et al. (2024), KLEMS-based benchmark. Defined as ψ = (1−ζ)/ζ where ζ is the labour share (≈ 0.45). |
| Time-trade elasticity (β₂) | −0.036 per day: Heid, Larch & Yotov (2021), Table 2 col. 5. Panel PPML with bilateral fixed effects, 1995–2016. |
| Shock specification | Only Pakistan’s international export trade costs are shocked: B[PAK→j] = exp(0.036 × Δt) for all j ≠ PAK. Domestic trade row unaffected. |
| Baseline trade data | ITPD Release 1.1 (Borchert et al., 2022). Average of 2017–2019, goods sectors only, 237 countries. Nine country-pairs with zero trade dropped. |
| Pakistan baseline exports | USD 28,294M (ITPD 2017–2019 goods average). |
| Baseline dwell time | 6.5 days mean (LPI 2.0, 2024 round, CT_DT_X indicator). |
[1] We use ITPD-S data, which is purpose-built trade data for GE simulation.