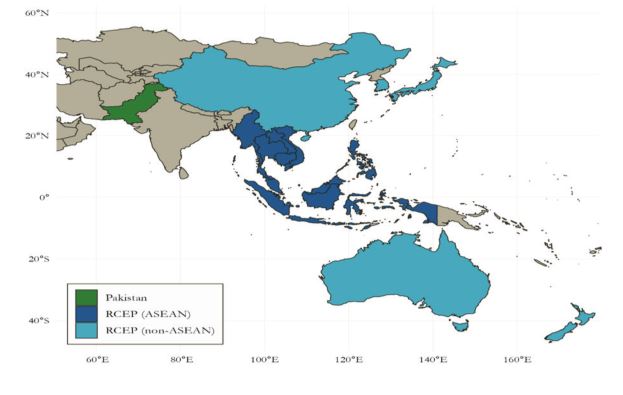
Regional integration is becoming increasingly pivotal for economies to secure market access, diversify exports, and attain resilience against global disruptions. In this context, Pakistan’s engagement with regional blocs such as the Regional Comprehensive Economic Partnership (RCEP) is a matter of strategic necessity. The RCEP brings together fifteen economies across East Asia and the Pacific. The bloc includes ten ASEAN members, Brunei, Cambodia, Indonesia, Laos, Malaysia, Myanmar, the Philippines, Singapore, Thailand, and Vietnam, alongside five non-ASEAN economies, China, Japan, South Korea, Australia, and New Zealand. The agreement signed in 2020 and officially entered into force on January 1, 2022. Figure 1, situating Pakistan against this bloc, shows that RCEP is not a distant Asia-Pacific arrangement but a market, and a supply chain network, on Pakistan’s own doorstep.
Figure 1. Pakistan and RCEP Member Countries
The RCEP bloc forms the world’s largest free trade agreement by population and economic weight, anchoring regional value chains and production networks that increasingly define how goods, inputs, and investment move across Asia. Currently, RCEP accounts for 28.0 percent of world trade and 31.8 percent of world GDP[1].
What sets RCEP apart is momentum, not just size. Table 6 compares the bloc to Pakistan’s traditional partners, the US, UK, and EU27, on trade share, GDP, and growth since 2016. RCEP already leads on GDP (31.8% of world output vs. 23.3% for the US, 16.0% for the EU27, 3.4% for the UK) and trails the EU27 only marginally on trade. More telling: its real GDP is growing at 3.9% annually, roughly 1.5-2x faster than the US and several multiples above the EU27 and UK, while its trade share keeps climbing as the UK’s shrinks. RCEP is the fastest-growing bloc Pakistan could realistically integrate with, just as its traditional partners slow down.
Table 1. Size and Momentum of RCEP Market Against the USA, UK and EU27
| Indicator | Share in world, 2025 (%) | Growth, CAGR 2016-2025 (%) | ||||||
| RCEP | USA | UK | EU27 | RCEP | USA | UK | EU27 | |
| Trade (exports + imports) | 28.0 | 12.0 | 3.2 | 30.7 | 4.9 | 4.8 | 3.7 | 4.6 |
| Population | 28.2 | 4.2 | 0.8 | 5.5 | 0.3 | 0.6 | 0.7 | 0.2 |
| GDP, real (2015 US$) | 31.8 | 23.3 | 3.4 | 16.0 | 3.9 | 2.5 | 1.1 | 1.4 |
| GDP per capita, real (2015 US$) | 3.5 | 1.9 | 0.5 | 1.3 | ||||
Source: Source: ITC Trade Map (trade) and World Bank WDI (population, GDP, constant 2015 US$). Growth is CAGR, 2016-2025. RCEP figures are summed across its 15 members, population-weighted for GDP per capita.
Pakistan’s absence from this bloc is structural. When RCEP was signed in 2020, Pakistan was not invited to join, largely because it lacks the prerequisite: a free trade agreement with ASEAN, the ten-country core RCEP is built around.[2] Five years on, that gap remains.
India’s Widening Reach
India continues to expand its network of major trade agreements on its own timeline. The India-UK trade agreement (CETA) gives India duty-free access on 99 percent of UK tariff lines through a binding treaty. The EU-India FTA, finalized after nearly two decades of negotiation, does the same for the EU market. Both land in markets where Pakistan’s own exports are concentrated. Pakistan’s UK access runs through the unilateral Developing Countries Trading Scheme, revocable and conditional rather than a negotiated treaty, and India’s exports to the UK were already 6.6 times Pakistan’s by 2025.[3] In the EU, which absorbs about a third of Pakistan’s total exports, nearly 80 percent of it textiles and apparel resting on preferential access under GSP+, India’s improving terms narrow Pakistan’s competitive margin further as its own EU tariffs come down.[4]
It is important to note that Pakistan’s market access to the EU and UK depends on unilateral, trade preference. Unlike bilateral or multilateral trade agreements, schemes like GSPs are periodically reviewed and are revocable unilaterally by donor country. Moreover, Pakistan needs export diversification both in terms of products and destination markets. RCEP cannot offset potential trade losses in the EU and UK markets directly, but it is one part of the answer, a large, fast-growing bloc where Pakistan could still build a negotiated position from scratch.
Untapped Potential in a Market of Scale
Given geographic proximity and diverse market nature of the RCEP, a bloc that imports US$6.3 trillion a year from the rest of the world, should be a natural destination for Pakistan. However, Pakistan supplies only US$5.4 billion of its import which amounts to a share of just 0.08 percent. In other words, for every US$1,250 RCEP spends on imports, imports of less than US$1 comes from Pakistan. This is not a small gap; it is a bloc where Pakistan is absent in practical terms.
Even in China, Pakistan’s largest single RCEP market, its US$2.8 billion in exports amounts to only 0.11 percent of China’s total import bill.[5] This is not a story of Pakistan lacking competitive products. Pakistan holds a global Revealed Comparative Advantage score above 0.5 across a wide range of goods, from textiles and meat to plastics, copper, and industrial chemicals. The gap is one of market access and positioning, not underlying capability.
Table 2. Pakistan’s Exports to RCEP by Sector
| Sector | Exports to World (m.US$) | Exports to RCEP Bloc | ||
| Value (m.US$) | Share (%) | CAGR (%) | ||
| Textiles & Clothing (HS50-63) | 17,973.2 | 1,228.8 | 6.8 | -4.2 |
| Metals (HS72-83) | 1,224.7 | 1,224.7 | 100.0 | 24.8 |
| Plant-Based Products (HS06-15) | 3,731.1 | 732.8 | 19.6 | 12.4 |
| Minerals (HS25-26) | 798.8 | 500.0 | 62.6 | 11.5 |
| Animal-Based Products (HS01-05) | 1,098.2 | 451.9 | 41.1 | 9.3 |
| Fuels (HS27) | 744.3 | 414.8 | 55.7 | 7.6 |
| Food Products (HS16-24) | 1,190.8 | 258.6 | 21.7 | 0.0 |
| Chemicals (HS28-38) | 663.5 | 154.2 | 23.2 | 2.5 |
| Miscellaneous (HS90-99) | 1,072.4 | 133.2 | 12.4 | 4.2 |
| Hides & Skins (HS41-43) | 804.1 | 109.5 | 13.6 | -8.1 |
| Wood (HS44-49) | 118.9 | 34.8 | 29.2 | -4.9 |
| Stone & Glass (HS68-71) | 65.3 | 20.6 | 31.6 | 7.5 |
| Plastics & Rubber (HS39-40) | 536.9 | 16.8 | 3.1 | -6.6 |
| Footwear (HS64-67) | 192.1 | 14.2 | 7.4 | 12.2 |
| Machinery & Electronics (HS84-85) | 355.5 | 8.4 | 2.4 | 0.1 |
| Transportation (HS86-89) | 104.2 | 4.2 | 4.0 | -8.4 |
Source: ITC Trade Map. Exports to World is Pakistan-reported; Exports to RCEP is RCEP members’ own reported imports from Pakistan, summed across all 15 members, most recent available year (2025 where reported). CAGR uses years actually reported; Laos, Vietnam, and Myanmar have incomplete latest-year data.
Textiles and clothing, Pakistan’s largest export category worldwide, is narrowly the largest RCEP-bound sector too, but it is shrinking within the bloc at 4.2 percent a year. Metals, driven almost entirely by copper shipped to China, has overtaken textiles in growth terms, expanding at 24.8 percent annually, while plant-based products and minerals compound at double-digit rates.[6] Thirteen of Pakistan’s top twenty RCEP-bound products are already gaining share in a growing market; the problem is that its largest and most politically prioritized sector is the one losing ground.
A product-level screen against RCEP import demand identifies eleven specific opportunities where Pakistan has demonstrated global competitiveness but almost no current RCEP presence: plastic sheets and film, pneumatic tyres, flat-rolled steel, soap, and inorganic chemicals among them, with China, Japan, South Korea, and Thailand as leading destinations.[7] These are products Pakistan already exports competitively to the rest of the world, sitting largely untapped in a market growing faster than any of Pakistan’s traditional trade partners.
Charting a Path to Accession
Pakistan should pursue preferential access with RCEP’s largest economies, rather than waiting on a comprehensive ASEAN FTA that has shown no momentum in over a decade. There is enough trade complementarity to accommodate Pakistan’s exports to RCEP economies. Start can be with targeted products as mentioned above. It is noteworthy that export promotion should rebalance away from an over-reliant on textiles, toward plant-based products and other labor-intensive industrial goods. Table 3 below presents products with significant demand from the RCEP side, while Pakistan’s exports to the bloc are none or negligible. Focusing on exporting these additional products to the RCEP bloc would also help diversify Pakistan’s export portfolio.
Table 3. Candidate New Export Products for Pakistan in RCEP
| Product | RCEP Import Demand
(US$ million) |
Top Markets |
| Plastic sheets and film (non-cellular) (3920) | 16,018.7 | China, South Korea, Japan |
| New pneumatic tyres(4011) | 9,824.8 | Australia, Japan, South Korea |
| Flat-rolled steel, coated or plated (7210) | 9,720.9 | Thailand, Philippines, South Korea |
| Polystyrene, primary forms (3903) | 5,859.5 | China, Vietnam, Thailand |
| Edible offal (bovine, swine, etc.) (0206) | 4,804.6 | China, Japan, Philippines |
| Carbonates (inorganic chemicals) (2836) | 4,746.8 | China, South Korea, Indonesia |
| Fresh or chilled beef (0201) | 3,882.0 | Japan, South Korea, China |
| Soap and organic surfactants (3401) | 2,986.1 | China, Australia, Japan |
Recently, launching the Vietnam-Pakistan PTA is a step toward connecting with RCEP; however, this bilateral opening now needs to be scaled into a systematic accession strategy:
As preparatory measures, Pakistan should design a tariff and para-tariff mapping exercise for relevant inputs, along with aligning Sanitary and Phytosanitary (SPS) regulations, to reduce technical friction and expedite the accession process once negotiations start.
On the diplomatic track, leveraging the existing Pakistan-China relationship, paired with direct ministerial-level visits to key ASEAN capitals, can help lobby for sponsorship. Platforms such as the SCO and BRI summits are valuable opportunities in this regard.
At the institutional level, it is valuable to establish a dedicated RCEP task force or cell, comprising legal and economic expertise, to formulate a prudent accession strategy. This may involve relevant ministries, the FBR, along with business chambers.
Currently it is a good time for a new entrant to get integrated into the bloc. RCEP’s first general review is scheduled for 2027, whereas its bilateral trade flows and supply chains are still forming. Every year Pakistan stays outside will be a lost opportunity while RCEP’s weight becomes harder to catch up to. While the accession partly accommodates lost market access in the EU and the UK. It is an important lever still open on Pakistan to strengthen its regional integration.
Amjad Masood is Chief of Research/Director, Center for Trade, Logistics, and Infrastructure (CTLI) at the Pakistan Institute of Development Economics (PIDE)
[1] ITC Trade Map (trade data) and World Bank World Development Indicators (GDP, population), 2025 data; growth rates are CAGR 2016-2025. RCEP figures are summed (trade, population, GDP) or population-weighted (GDP per capita) across its 15 members.
[2]Positioning Pakistan for Integration with the Regional Comprehensive Economic Partnership (RCEP), Pakistan Business Council.
[3]India-UK Comprehensive Economic and Trade Agreement (CETA) official text summary; UK Developing Countries Trading Scheme (DCTS) guidance; ITC Trade Map, UK import data 2005-2025.
[4]ITC Trade Map, India and Pakistan export profiles to the EU, 2025; EU-India Free Trade Agreement text summary.
[5]ITC Trade Map, RCEP members’ reported imports from Pakistan and from the world, 2025.
[6]ITC Trade Map, Pakistan’s exports to RCEP by HS2 sector, 2016-2025.
[7]Revealed Comparative Advantage (RCA) screen against RCEP import demand, computed from ITC Trade Map, 2025.