Education is the fundamental requirement to enter into productive and meaningful labor market across the world. Therefore, any issue or problem that hinders the access to education will cost the productivity of an individual as well as the country at large. This is why education and particularly “inclusive and quality education for all” has a central place in all development goals such as sustainable development goals (SDGs). However, the ground reality is at contrast as the children all over the world especially in developing countries face various inequalities and discrimination in education such as by gender, income, ethnicity to name a few. One form of educational inequality that has adverse effect not only on an individual but the family and society as well is the discrimination related to disability. Persons with a disability are more vulnerable to exclude from education. The gap between children with and without disabilities have significantly increased over the last three to four decades. It can be said that children having disabilities have been greatly neglected in efforts undertook for education improvement in the developing world (World Bank/GPE report ,2018). Studies have shown that educational deficit due to disability has great impact than due to income, gender, urbanization and mother’s education. Elimination of educational inequalities, therefore, is one way to achieve SDGs.
Many policies and laws are in place to protect the right of people with special needs at international and national level. For instance, the Declaration of Human Rights (1948) has recognized the right of education for all. Similarly, Article 24 of The United Nations Convention on the Rights of Persons with Disabilities (CRPD), has strongly articulated and mandate the member states to ensure the inclusive quality education for the person with disabilities. The Convention on the Rights of the Child and the Convention on the Rights of Persons with Disabilities also reiterate the right of education for person with special needs (Fotso et al., 2018).
Article 25-A and Article 26 of the 1973 Constitution of Pakistan articulates the provision of non-discriminatory and free and mandatory education for all children aged 5-16 years. Pakistan is also signatory to United Nations Convention on the Rights of the Child and CRPD, which make it responsible to ensure the legislative frameworks for provision of inclusive quality education to the persons with disabilities. Vision 2025 of Pakistan also recognized the importance of investing in human capital with particular focus on vulnerable and minority groups such as children with special needs. Vision 2025 proclaims the presence of a special quota in education for people with special needs and for non-Muslim population and also on enhancement of sport facilities for people with disabilities.
Despite overall progress in education enrollment and attainment in Pakistan, statistics on children with disabilities are very poor. Children with disabilities have been seen to have a low participation and completion rate when compared to their counterparts having no disabilities. As mentioned earlier, persons with a disability are more vulnerable to be excluded from education. At the same time, data on disability is scarce. Hence Pakistan Demographic Health Survey (PDHS) 2017-18 very first time included the disability information in their module and later Pakistan Social Living Measurement (PSLM) 2019-20 also followed the suit. Taking the opportunity, this policy view point analyzes educational disparities in relation to disability based on data from Pakistan Social Living Measurement 2019-20 for five education indicators:
- Share of 15- to 29-year-olds who ever went to school
- Out-of-school rate (primary school age, lower secondary school age)
- Completion rate in terms of primary or lower secondary education completion.
- Average years of schooling for the people 25 years and above.
- Adult literacy rate (population 15 years and older)
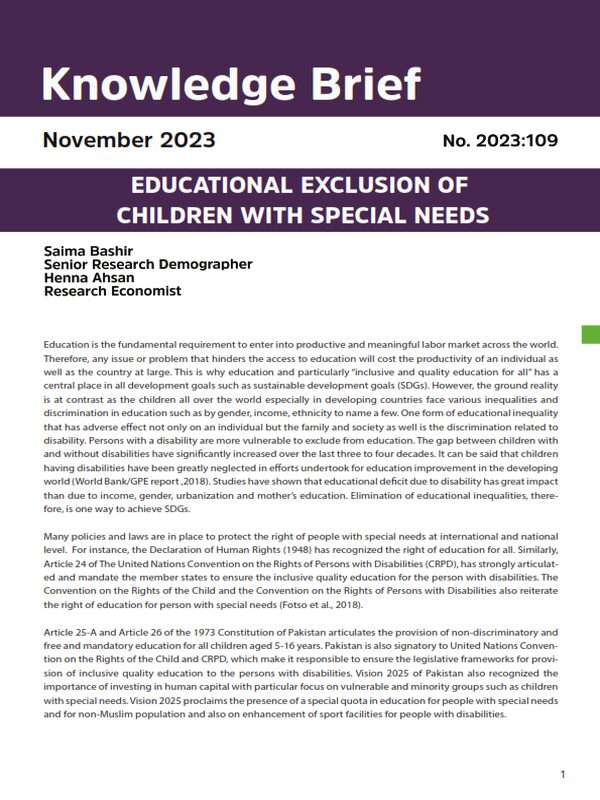
Definition of disability is not universal and it remains a challenge for surveys across countries to come up with a uniform definition. In 2001, The Washington Group (WG) on Disability Statistics was established with the purpose to have a comparable measure of disability. The group formulated a set of questions to identify a person with disability. The questions address six core functional domains—seeing, hearing, communication, cognition, walking, and self-care—and provide basic necessary information on disability comparable to that being collected worldwide via the WG disability tools (NIPS 2018). The respondents report whether they have no difficulty, some difficulty, a lot of difficulty, or no ability at all in the specified domain. These questions are asked from all de facto members of the household age 5 and above. As per standards defined by Washington Group a person is said to have a disability if he answers “a lot of difficulty” or “cannot do at all” on any of the six functional domains.
PSLM 2019-20 survey is consistent with the definition of WG disability tools. As per PSLM (2019-20) 10.8 % have some level of difficulty in functioning in at least one of the domains, whereas 3.53 % reported a lot of difficulty or no ability to function at all in at least one of the domains and 7.24 % of the households surveyed has persons suffering from one of the six domains of disability.
| Disability Parity Index
Disability parity index (DPI) is calculated by dividing the indicator value for persons with disabilities by the value for persons without disabilities. Depending on the underlying indicator, parity indices less than 1 or greater than 1 indicate that persons with disabilities are disadvantaged. DPI values less than 1 indicate exclusion of persons with disabilities for the majority of indicators, such as mean year of schooling, primary school completion rate, with the exception of out-of-school rate, an indicator whose value decreases with improvements in the education system; here, a parity index greater than 1 indicates disadvantage for persons with disabilities because it means that they are more likely to be out of school (UNESCO, 2018). |
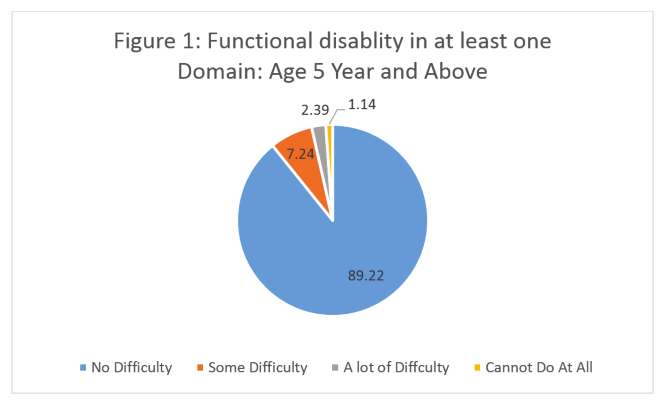
Table 1 shows the proportion of population between 15 to 29 years which ever attended school. Though these numbers do not provide any information regarding number of years a disable person spends in the school, however, these do tell us mean years of schooling for 15 to 29 years and older without disabilities and with disabilities. Stats show that percentage of disabled persons who ever attended school is significantly lower than persons without disability. It has been observed that among total population of disabled only 31% ever attended school. The disability parity index of 0.67 shows that children with disabilities are 33% less likely to ever attend school when compared to children without disabilities. Further analysis also shows that disable females are more disadvantaged when it comes to formal education than their male counterparts and also low when compared to female without any disability with a parity index of 0.65.
Out of school Children (aged 6 to 11 years)
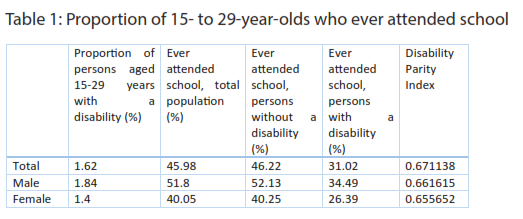
These are the children who are not attending the school or have attended it in past but dropped out or never attended the school. Overall, one quarter of the children without disability are out of school with more female than male children (Figure 2). However, when this situation is analyzed for disable children the situation is worse. Children with disabilities are more than twice likely to be out of school when compared to children without disabilities. Moreover, within disable group female are more out of school than male as 71.5% female are out of school compared to 67.6 % of male.
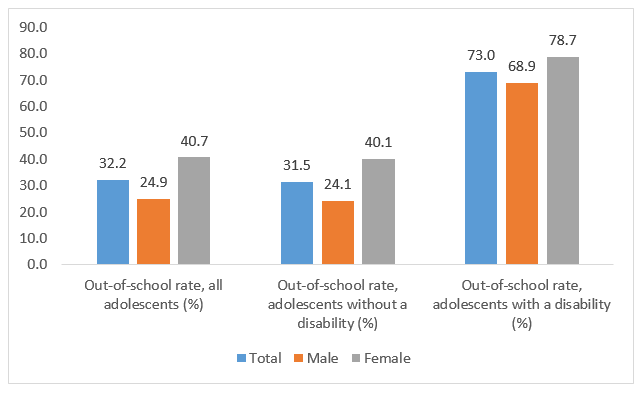
 Though the statistics are not very encouraging for lower secondary schooling for children without any disability, out of school rate for lower secondary education (children usually in the age bracket of 12 to 14 years) is disproportionately higher for children with special needs. More than two third of disable adolescents are out of school (Figure 3).
Figure 3: Out-of-school rate (lower secondary school age 12-14 years)
Mean years of schooling are the total years completed for the primary or higher levels but do not include the years spent to repeat an individual grade. This indicator is calculated for the population 25 years and above assuming that most people complete their formal education at this age and enter into the job market. Stats show that mean years of schooling is almost half of non-disabled children.
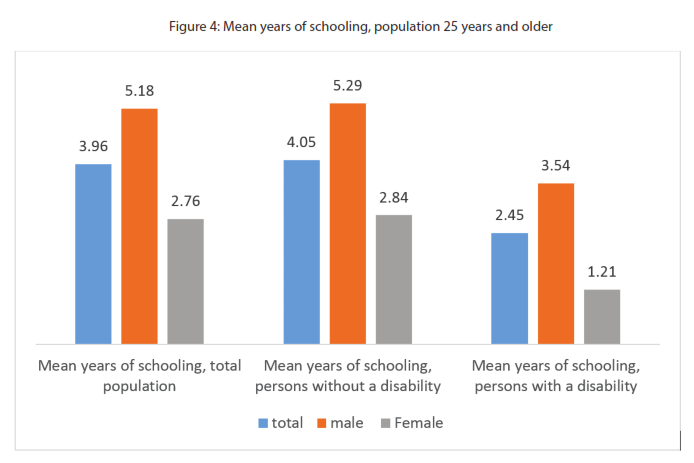 Table 5 shows the literacy rate for the disabled and non-disabled population. Literacy rate is typically defined as the ability to read and write, with understanding, a short, simple statement about everyday life (United Nations, 2015).
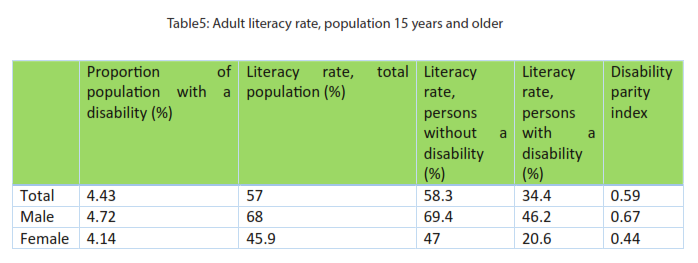 Literacy rate among the disabled is quite low when compared to non-disabled persons with a parity index of 0.59. Gender differences are at stark, however, females with special needs are at more disadvantaged and missed out the opportunity to get an education. The difference in literacy rate among disabled female is more than half when compared to disabled male. Gender parity index shows that female without disability have low literacy rate (47/69.4=0.68) while female with disability is even more deprived with gender parity at a further low value (20.6/46.2= 0.45).
Conclusion and Recommendations
The National Education Policy adopted in 2017 pledged to give particular attention to inclusive and special education. It aimed to ensure presence of at least fifty percent disabled children in schools by 2025, however, seeing the above stats it is evident that a lot work still needs to need to be done. The poor educational statistics of children with special needs make it harder for them to integrate in to productive labor force and leads to decline in their productivity. United Nations Sustainable Development Goal 4 demands that country’s investment toward education should be 15-20 percent of the GDP however it is about 3% in Pakistan. Absence of credible data on disability and lack of coordination among ministries is one of the other problems that hinder the progress of inclusive education for disabled people in Pakistan.
- Making sure educational investments are made keeping in consideration the inclusivity of children with disabilities.
- Though the constitution and educational policies of Pakistan emphasize on quality and inclusive education, however, above statistics show greater gender disparity in education particularly among girls with special needs. Therefore, there is a need to implement the gender responsive policies in education in letter and spirit.
- Government and educational authorities need to ensure the availability of adequate tools at school level to provide quality education to the children with disabilities, encouraging parents to send their children with special needs to school.
- Moreover, ensuring the implementation of educational quota for children with disabilities as pledged in Vision 2025.
References:
Fotso, A.S., Solaz, A., Diene, M., and Nanfosso, R.T. (2018) Human capital accumulation of children in Cameroon: does disability really matter?, Education Economics, 26:3, 305-320.
UNESCO Institute for Statistics (UIS). (2018). Education and disability: analysis of data from 49 countries. Information Paper No. 49.
World bank /GPE (2018). Education: Children with disabilities are being left behind. https://www.worldbank.org/en/news/press-release/2017/12/01/children-with-disabilities-are-being-left-behind.