1. Background of study
Corruption is a global issue that is present in numerous countries. Its broad meaning is the misuse of public power for personal gain, which leads to a less efficient allocation of resources than would be the case in an environment free of corruption. Corruption hinders social development, investment, and economic progress in several ways. The first effect of corruption is to decrease the effectiveness of government institutions and distort the distribution of resources. Additionally, it might cause capital flight and hinder international investment. Thirdly, corruption threatens the rule of law, which is necessary for economic growth.
|
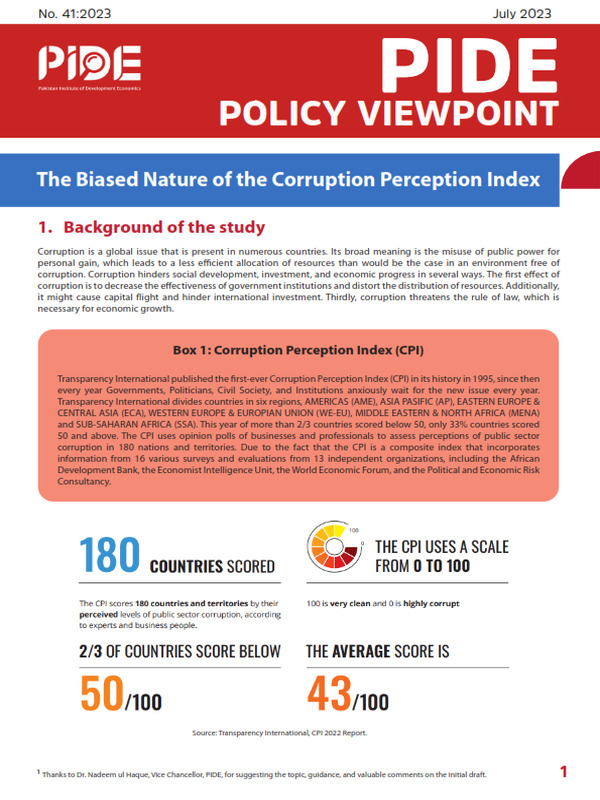
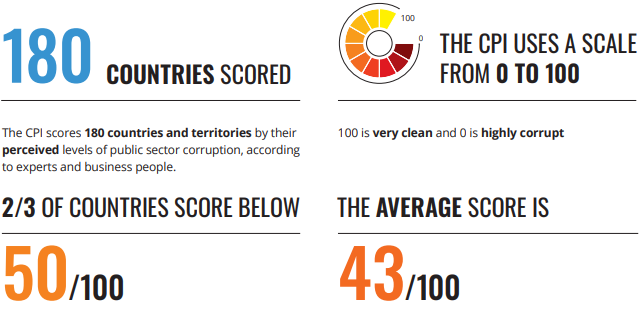
Box 1: Corruption Perception Index (CPI) Transparency International published the first-ever Corruption Perception Index (CPI) in its history in 1995, since then every year Governments, Politicians, Civil Society, and Institutions anxiously wait for the new issue every year. Transparency International divides countries in six regions, AMERICAS (AME), ASIA PASIFIC (AP), EASTERN EUROPE & CENTRAL ASIA (ECA), WESTERN EUROPE & EUROPIAN UNION (WE-EU), MIDDLE EASTERN & NORTH AFRICA (MENA) and SUB-SAHARAN AFRICA (SSA). This year of more than 2/3 countries scored below 50, only 33% countries scored 50 and above. The CPI uses opinion polls of businesses and professionals to assess perceptions of public sector corruption in 180 nations and territories. Due to the fact that the CPI is a composite index that incorporates information from 16 various surveys and evaluations from 13 independent organizations, including the African Development Bank, the Economist Intelligence Unit, the World Economic Forum, and the Political and Economic Risk Consultancy. |
Ethnicity and economic growth are two important factors that can influence corruption levels in a country. Therefore, understanding the factors that contribute to corruption is essential for policymakers to develop effective measures to combat it. This research report aims to investigate the relationship between economic growth, ethnicity, and panel-country corruption levels. Specifically, it seeks to answer the question: do economic growth and ethnicity explain the differences in panel-country corruption levels?
______________
[1] Thanks to Dr. Nadeem ul Haque, Vice Chancellor, PIDE, for suggesting the topic, guidance, and valuable comments on the initial draft.
 Source: Transparency International, CPI 2022 Report.
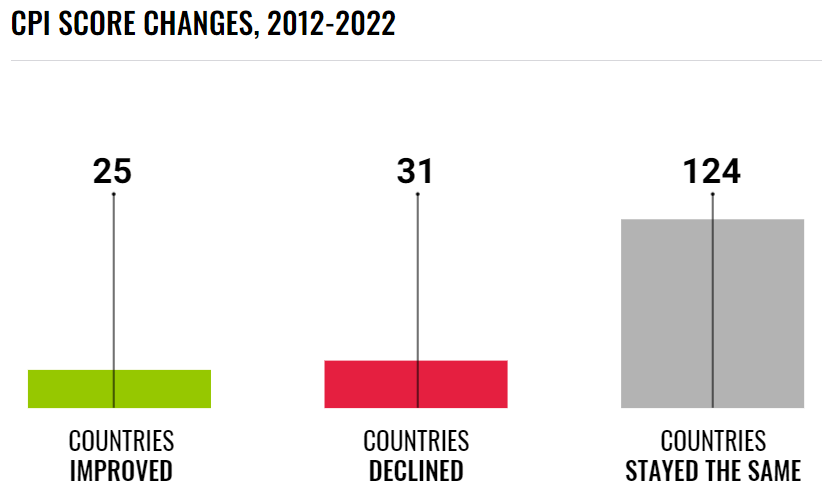
Transparency International has released the Corruption Perception Index (CPI) database each year since 1995 (Transparency International, 2022). It rates corruption on a scale of zero to one hundred, with one hundred being the cleanest possible. The average worldwide Score, which has remained constant at 43, is below 50 for more than two-thirds of the world’s nations (68%). Twenty-five countries have seen a substantial improvement in their rankings since 2012, while 31 significantly decreased and 124 countries stayed the same score.
Source: Transparency International, CPI 2022 Report.
The top of the CPI Index is frequently occupied by countries with sound institutions and functioning democracies. Denmark is ranked first overall with a score of 90. With scores of 87, New Zealand and Finland are close behind. The top 10 countries in the year of 2022 is completed by Norway (84), Singapore (83), Sweden (83), Switzerland (82), the Netherlands (80), Germany (79), Ireland (77), and Luxembourg (77).
On other hand, conflict-ridden countries, or those whose fundamental political and personal liberties have been severely restricted tend to get the lowest ratings. South Sudan (13), Syria (13), and Somalia (12) are the three countries at the bottom of the ranking in 2022. The lowest 10 countries are Burundi (17), Venezuela (14), Yemen (16), Libya (17), North Korea (17), Haiti (17), Equatorial Guinea (17), and North Korea (17). Transparency International, CPI 2022 Report.
2. The Nexus between Corruption and Economic Growth
The relationship between corruption and economic growth has been extensively examined in the existing literature. In general, academic literature indicates that corruption has an adverse impact on economic growth, particularly among developing countries with weak institutions. The relation between corruption and economic growth, however, could be more nuanced than previously imagined. According to some research, corruption can even promote economic growth under specific conditions, such as in countries with advanced institutional frameworks. Contrary, various studies conclude corruption can restrict foreign investment, undermine the efficiency of the legal and regulatory systems, and raise transaction costs, all of which can slow down economic growth.
In contrast, few studies have explored the relationship between ethnicity and corruption. Some scholars argue that ethnicity can affect corruption levels, as it can create a sense of social identity and reduce the willingness to cooperate with people from different ethnic backgrounds. However, other studies suggest that ethnic diversity can foster accountability and transparency in the political and economic systems. Further research is needed to better understand the complex relationship between corruption and economic growth and to develop effective anti-corruption policies.
CPI has been used by the international agencies (who remain outside the CPI system) as well as the moralistic advanced countries most of which are white to beat on the poor corrupt countries. Most recently the IMF in its conditionality has used the CPI to put conditions that are non-economic on Pakistan. This is why we will attempt to understand the biases in the CPI and its meaning.?
We are particularly curious about whether race matters. Is there a racial bias in the CPI? In addition, CPI measures anything other than underdevelopment. Is that rich countries always show up as clean and poor not?
3. Data Analysis
This research is based on panel data using 169 countries (available data for the variables) considered by Transparency International (TI) 2022, for the Corruption Perception Index (CPI) Score which is used as a measure of corruption levels. GDP per capita (constant 2015 US dollars), which was obtained from the data bank of the World Bank’s World Development Indicators (WDI) online database over the period 2012–2022. Further, this analysis used a binary dummy for white-race countries, while the rest of the countries were kept as a reference attribute.
Our data sample has 28 % white race countries that lie at the highest level in the Score of CPI, and the remaining are non-white countries that lie at the bottom level in the CPI Scores. Further, we can investigate and quantify it with multiple regression analysis. The data is analysed using panel data regression analysis, which allows for the examination of the relationship between corruption, GDP per capita growth, and ethnicity while controlling for other factors that may affect corruption levels.
4. Conclusion and Policy Recommendations
In conclusion, this report shows that economic growth and ethnicity both have a positive and significant impact on corruption levels in panel-country analysis. Countries with higher per capita income and white race tend to have lower corruption levels at the 1% significance level.
The analysis is carried out by Panel Corrected Standard Error (PCSE) regression to establish a relationship explaining better scores in CPI by race (White Countries) and GDP per capita income growth. The results indicate a positive statistically significant impact of GDP per capita growth and white race dummy on CPI score at the 1 % significance level. It is found that if there is a 1% increase in GDP per capita, it leads to raise significantly difference from zero in the score of CPI by 8.74. This can be explained by the fact that income per capita leads to greater transparency, accountability, and more efficient governance. Further, it concludes that a white race country can get 7.42 more points in the CPI score than a non-white country at the 1% level of significance. It means being white race and rich, a country can get 7.42 score more transparent in the corruption perception index. The regression’s reported is .7778, which is excellent it means 78% of the variations in CPI score is explained by only two variables i.e., white race dummy and per capita income.
It was found that white race countries (West Europe/EU) have scored higher (above median) in CPI than other regions. Another connotation is observed between CPI score and per capita income; the countries with good per capita income also scored well in CPI. We call a country “Best Performer”, having a good score and higher per capita income. Most European countries (white race) fall in the “Best Performing Group.” It is also observed that USA and Canada (from the Region Americas) and Australia & New Zealand (from the region Asia and Pacific) also fall in the best-performing group. Surprisingly, it is observed that better CPI scores and good per capita income have a strong positive relationship with white-race countries in empirical analysis. The results suggest that economic growth can be an effective tool for reducing corruption in countries with diverse ethnic populations.
To address its biases and constraints, Transparency International should regularly examine and improve the CPI methodology. To achieve higher reliability and accuracy, this can entail adding objective indicators, considering alternate data sources, and doing meticulous statistical analysis.
To get a more fair and complete view of corruption, policymakers must think about using a variety of corruption indices and data sources. It may be challenging to develop effective policy by relying simply on the CPI and result in a biased view of corruption dynamics.
Policymakers may take a more nuanced and evidence-based approach to fighting corruption by admitting the biases involved in the index, which will ultimately result in the formulation and application of policies that are more effective.
References
Ades, A. & Di Tella, R. (1997). The new economics of corruption: A survey and some new results. Political Studies, 45(3), 496-515.
Aïssaoui, R., & Fabian, F. (2021). Globalization, economic development, and corruption: A cross-lagged contingency perspective. Journal of International Business Policy, 1-28.
Awan, R. U., Akhtar, T., Rahim, S., Sher, F., & Cheema, A. R. (2018). Governance, corruption and economic growth. Pakistan Economic and Social Review, 56(1), 1-20.
Bardhan, P. (1997). Corruption and development: A review of issues. Journal of Economic Literature, 35(3), 1320-1346.
Campos, J. E., & Pradhan, S. (2007). The impact of corruption on investment: Predictability matters. World Development, 35(3), 533-547.
Gupta, S., Davoodi, H., & Alonso-Terme, R. (2002). Does corruption affect income inequality and poverty? Economics of Governance, 3(1), 23-45.
Kaufmann, D., & Wei, S. (1999). Does ‘grease money’ speed up the wheels of commerce? NBER working paper, 7093.
Knack, S., & Keefer, P. (1995). Institutions and economic performance: Cross-country tests using alternative institutional measures. Economics and Politics, 7(3).
Lambsdorff, J. G. (2006). Causes and consequences of corruption: What do we know from a cross-section of countries? In Handbook of Economic Growth (pp. 1-74). Elsevier.
Mauro, P. (1995). Corruption and growth. Quarterly Journal of Economics, 110(3), 681-712.
Tanzi, V., & Davoodi, H. (1997). Corruption, public investment, and growth. IMF Working Paper No. 97/139.
Wei, S. J. (2000). How taxing is corruption on international investors? Review of Economics and Statistics, 82(1), 1-11.