The Economic and Environmental Cost of Election 2024
Highlights
- The overall economy of the General Election 2024 surpasses PKR 1013 billion, equating to approximately 1.18 percent of the annual GDP.
- The environmental footprint of the General Election 2024 is estimated to account for approximately 6.64 percent of the annual GDP. This estimation considers the environmental benefits forfeited due to the utilization of trees for producing ballot papers and campaign materials. Factoring in all associated elements, the overall impact could escalate to approximately 10 percent of GDP.
An overview of General Election 2024:
It is an undeniable reality that our reliance on technology for elections lags even in the 21st century, largely due to the 37.7 percent illiteracy in Pakistan[1]. Given the prevalence of high illiteracy rates in the country, symbols serve as a straightforward means to facilitate voting. Consequently, while ballot papers include candidate names, they also feature corresponding symbols. This allows voters to easily identify their preferred choice by placing a stamp on the corresponding symbol, underscoring the heightened significance of visual cues for recognition.
The 2024 electoral process in Pakistan also rely on a ballot paper-based system. This election involves 128 million voters. This necessitated the production of at least 256 million ballot papers for both national and provincial assemblies. As a result, the Election Commission of Pakistan (ECP) printed 260 million watermarked ballot papers for the General Election (GE) 2024. This marks a significant increase of 40 million additional ballot papers compared to the previous GE-2018, which had a count of 220 million, owing to the rise in registered voters from 106 million to 128 million.
A single ballot paper usually contain a long list of options for voters in Pakistan as election process typically involves thousands of candidates and dozens of political parties and symbols. In GE-2024, 17,816 candidates from 150 political parties and as an independent candidates contested. Hence, a total of 150 symbols had been assigned to political parties and another 174 symbols were allotted to independent candidates.
In 2018, the creation of special watermarked ballot papers (220 million) required 800 tons of paper, whereas this year’s printing for 260 million ballot papers has utilized a total of 2,170 tons of paper. A notable surge of 171 percent in paper consumption for the production of ballot papers is due to the rise in the number of candidates across different constituencies.
To facilitate such a large-scale electoral process, a significant administration and associated costs are indispensable. For the GE-2024, the ECP designated 90,675 polling stations. Among these,
41,403 were combined stations, with 25,320 allocated for male voters and 23,952 for female voters. The distribution of polling stations across provinces included 50,944 stations in Punjab, 19,006 in Sindh, 15,697 in Khyber Pakhtunkhwa, and 5,028 in Baluchistan. Additionally, a total of 276,398 polling booths were set up, comprising 147,552 for male voters and 128,846 for female voters. According to FAFEN initial report approximately 1.1 million polling staff members were employed to facilitate the election process effectively.
___________
[1] https://mofept.gov.pk/ProjectDetail/NjQ4ZTg2NjItOWM2NC00Y2IxLTkzMDgtMjU2OTFhMjA4NzNh
___________
The Electionomy: Economic Cost General Election 2024
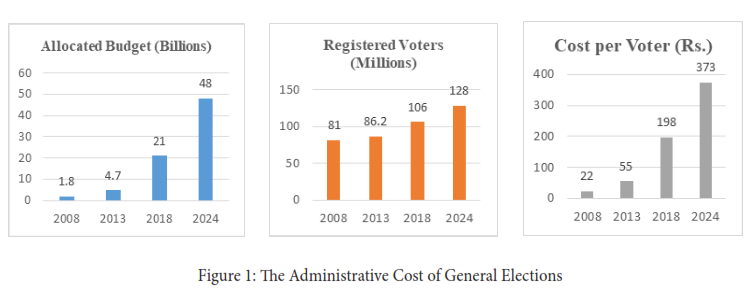
The total expenditure for the GE-2024 were estimated to be Rs. 48 billion, as approved by the government in the previous budget. There might be a supplementary grant allocated if deemed necessary. Over the past four elections, the overall cost has escalated significantly, soaring from 1.8 billion (in the General Election of 2008) to a staggering 48 billion (in the General Election of 2024). This increase is notable considering the rise in the number of voters from 81 million to 128 million, reflecting a growth of approximately 58 percent. However, when examining the expenditure per voter, there has been a substantial surge from Rs. 22 to Rs. 373 per voter, indicating a colossal increase of 1596 percent, the most convincing reason for this might be the inflationary burden but this increase is even bigger than that (See figure 1).
In comparison to the previous general election 2018, the increase in the number of voters is approximately 21 percent, rising from 106 million to 128 million. Concurrently, the government’s per voter expenditure has also risen by around 90 percent, climbing from Rs. 198 to Rs. 373. It’s worth noting that these estimations do not include expenses incurred by the provincial governments.

The Administrative Cost per Voter based on Voter Turnout:
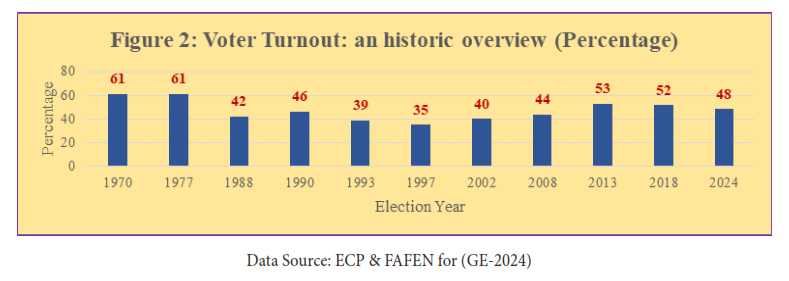
Another crucial factor in estimating the administrative cost of elections is to consider the actual voter turnout. In Pakistan, voter turnout typically remains low, resulting in a significantly higher cost per voter than initially anticipated. Figure 2 illustrates the voter turnout over the past 54 years, highlighting that turnout is still lower than general elections held in the 1970s. According to FAFEN, this year’s voter turnout stands at 48.2 percent, which is much lower than expected due to the closure of cellular services and internet facilities, greatly obstructing the voting process. In 235 National Assembly (NA) constituencies, Presiding Officers excluded 1.6 million ballots from the count. This figure is nearly identical to the number excluded during the 2018 General Elections[2].

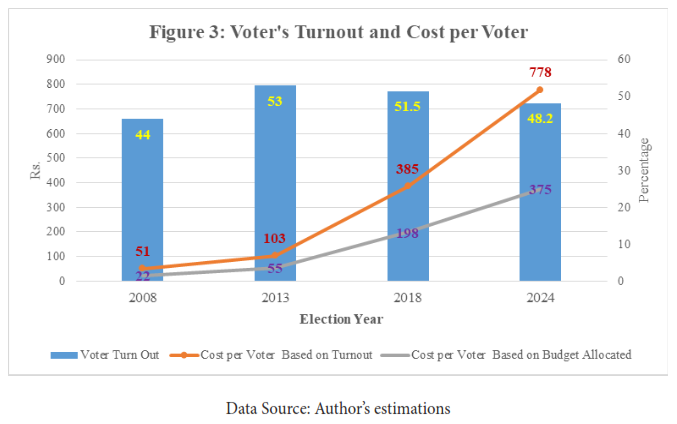
Comparing the last four General Elections, we observe that cost per voter in GE-2008 appeared to be Rs. 22 but on the base of voter turnout it rose to Rs. 51. Similarly in GE-2013, 2018 and 2024 the cost per voter is increased from Rs. 55 to Rs. 103, from Rs. 198 to Rs. 385 and from Rs. 375 to Rs. 778 respectively (see figure 3). Hence, the actual expenditure per voter are much more than that appeared initially.

Providing a precise estimation of the actual expenses borne by the government is challenging, as there could be various instances where the actual costs aren’t directly attributed to election expenses. Additionally, it doesn’t include expenses related to district returning officers who are government officials, already using government-provided resources like cars and fuel to carry out election duties. Other officials than DRO’s using similar resources can make this burden much bigger. So assuming that the expenditures by all tiers of governments, security establishment and donor funding are not more than the budget allocated to ECP than this cost would be approximately Rs. 96 billion or Rs 1556 per voter based on turnout.
_________
[2] https://fafen.org/fafen-preliminary-election-observation-report-of-general-election-2024/
_________


