The Structural Culpabilities of Pakistan’s Economy
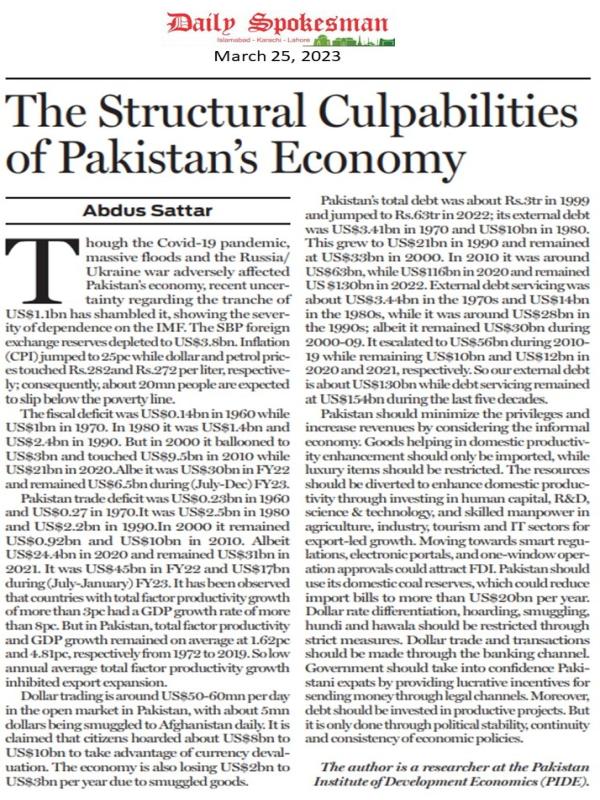
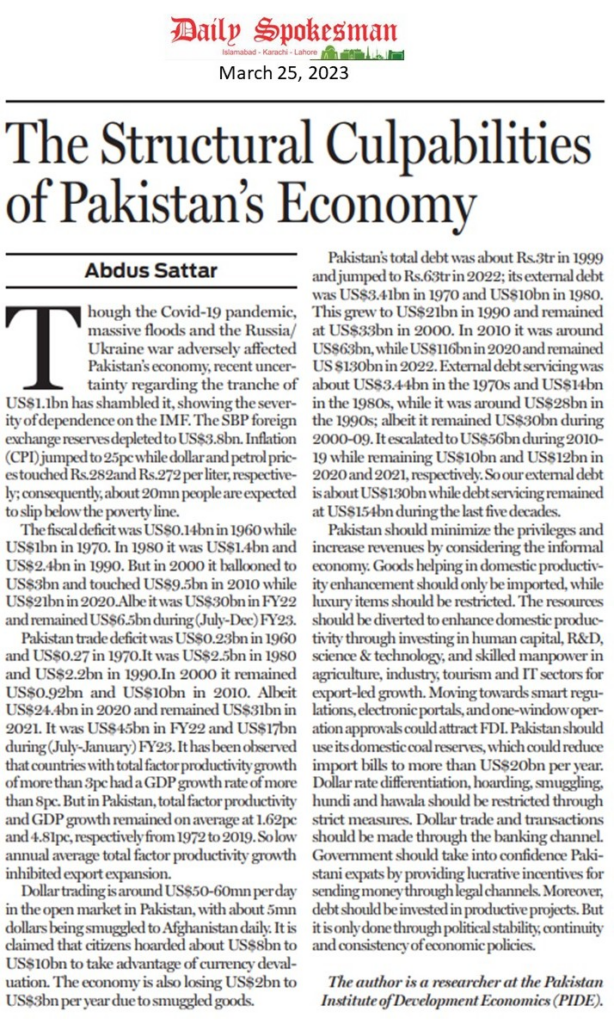
Though the Covid-19 pandemic, massive floods and the Russia/Ukraine war adversely affected Pakistan’s economy, recent uncertainty regarding the tranche of US$1.1bn has shambled it, showing the severity of dependence on the IMF. The SBP foreign exchange reserves depleted to US$3.8bn. Inflation (CPI) jumped to 25pc while dollar and petrol prices touched Rs.282and Rs.272 per liter, respectively; consequently, about 20mn people are expected to slip below the poverty line.
The fiscal deficit was US$0.14bn in 1960 while US$1bn in 1970. In 1980 it was US$1.4bn and US$2.4bn in 1990. But in 2000 it ballooned to US$3bn and touched US$9.5bn in 2010 while US$21bn in 2020.Albe it was US$30bn in FY22 and remained US$6.5bn during (July-Dec) FY23.
Pakistan trade deficit was US$0.23bn in 1960 and US$0.27 in 1970.It was US$2.5bn in 1980 and US$2.2bn in 1990.In 2000 it remained US$0.92bn and US$10bn in 2010. Albeit US$24.4bn in 2020 and remained US$31bn in 2021. It was US$45bn in FY22 and US$17bn during (July-January) FY23. It has been observed that countries with total factor productivity growth of more than 3pc had a GDP growth rate of more than 8pc. But in Pakistan, total factor productivity and GDP growth remained on average at 1.62pc and 4.81pc, respectively from 1972 to 2019. So low annual average total factor productivity growth inhibited export expansion.
Economic privileges are around US$17.4bn (Rs.4250bn), or 6pc of the GDP. Only 20pc of Pakistan’s citizens own 50pc of the country’s wealth, while the less-privileged own only 7pc. Middle-class wealth, the backbone of any economy, dwindled from 42pc in 2009 to 36pc in 2019. The general government expenditures are accorded 22pc of GDP. The government controls 200 state-owned enterprises (SOEs), a burden of Rs.500bn annually for decades. Pakistan has 187bn tonnes of coal reserves and can produce 100,000 MW for more than two centuries. The gas and power sector, however, faces a circular debt of Rs.2.6tr, and electricity theft reached about Rs.380bn and is expected to rise to Rs.530bn in future.
Pakistan’s GDP was US$383bn (Rs.67tr) while revenue collection was Rs.6.15tr in FY22 and remained around Rs.4tr (July-Dec) in FY23. The tax-to-GDP ratio was 4.4pc in 1950, which escalated to 10pc in 1973, 13.5pc in 1981 and 14pc in 1989. In 1999 it was 13.2pc but dwindled to 9.1pc in 2000 and 9.2pc in 2022. Another issue is that only 4mn people pay tax. So Pakistan’s tax base is not expanding, while the size of the informal economy is about US$180bn, and tax evasion is more than Rs.300bn. Foreign Direct Investment was US$17mn in 1972, increasing to US$5.6bn in 2007, and then falling to US$2bn in 2021. The investment-to-GDP ratio was only 15pc, while domestic savings dwindled from 16.5pc in 2000 to 4pc in 2022.
Foreign remittances stood at US$0.4bn, US$2bn in 1976 and 1980, US$2bn in 1990 and US$1bn in 2000. In 2010 it was US$10bn, US $26bn in 2020 and US$31bn in 2022. It was US$16bn during (July-Jan) FY23 while US$20bn over the same period last year. Due to domestic currency devaluations, the open market dollar rate is much higher than the interbank rate in Pakistan. So some Pakistani expats are sending money through non-banking channels.
Dollar trading is around US$50-60mn per day in the open market in Pakistan, with about 5mn dollars being smuggled to Afghanistan daily. It is claimed that citizens hoarded about US$8bn to US$10bn to take advantage of currency devaluation. The economy is also losing US$2bn to US$3bn per year due to smuggled goods.
Pakistan’s total debt was about Rs.3tr in 1999 and jumped to Rs.63tr in 2022; its external debt was US$3.41bn in 1970 and US$10bn in 1980. This grew to US$21bn in 1990 and remained at US$33bn in 2000. In 2010 it was around US$63bn, while US$116bn in 2020 and remained US $130bn in 2022. External debt servicing was about US$3.44bn in the 1970s and US$14bn in the 1980s, while it was around US$28bn in the 1990s; albeit it remained US$30bn during 2000-09. It escalated to US$56bn during 2010-19 while remaining US$10bn and US$12bn in 2020 and 2021, respectively. So our external debt is about US$130bn while debt servicing remained at US$154bn during the last five decades. In the case of Pakistan, research studies show that when external debt is not spent on productive projects, it adversely affects economic growth.
Pakistan should minimize the privileges and increase revenues by considering the informal economy. Goods helping in domestic productivity enhancement should only be imported, while luxury items should be restricted. The resources should be diverted to enhance domestic productivity through investing in human capital, R&D, science & technology, and skilled manpower in agriculture, industry, tourism and IT sectors for export-led growth. Moving towards smart regulations, electronic portals, and one-window operation approvals could attract FDI. Pakistan should use its domestic coal reserves, which could reduce import bills to more than US$20bn per year. Dollar rate differentiation, hoarding, smuggling, hundi and hawala should be restricted through strict measures. Dollar trade and transactions should be made through the banking channel. Government should take into confidence Pakistani expats by providing lucrative incentives for sending money through legal channels. Moreover, debt should be invested in productive projects. But it is only done through political stability, continuity and consistency of economic policies.
The author is a researcher at the Pakistan Institute of Development Economics (PIDE).


